


Leaside & Bennington Heights Sales Statistics for November 2017

Jethro Seymour
Sell your home faster and for more money with the Seymour Real Estate Team. I started my sales career in 1994 with publishing and media sales...
Sell your home faster and for more money with the Seymour Real Estate Team. I started my sales career in 1994 with publishing and media sales...
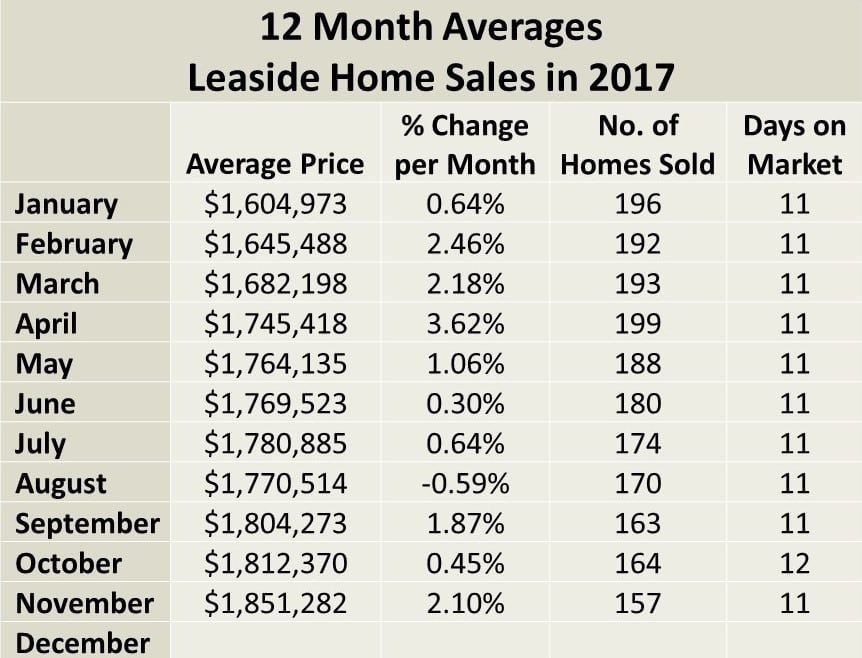
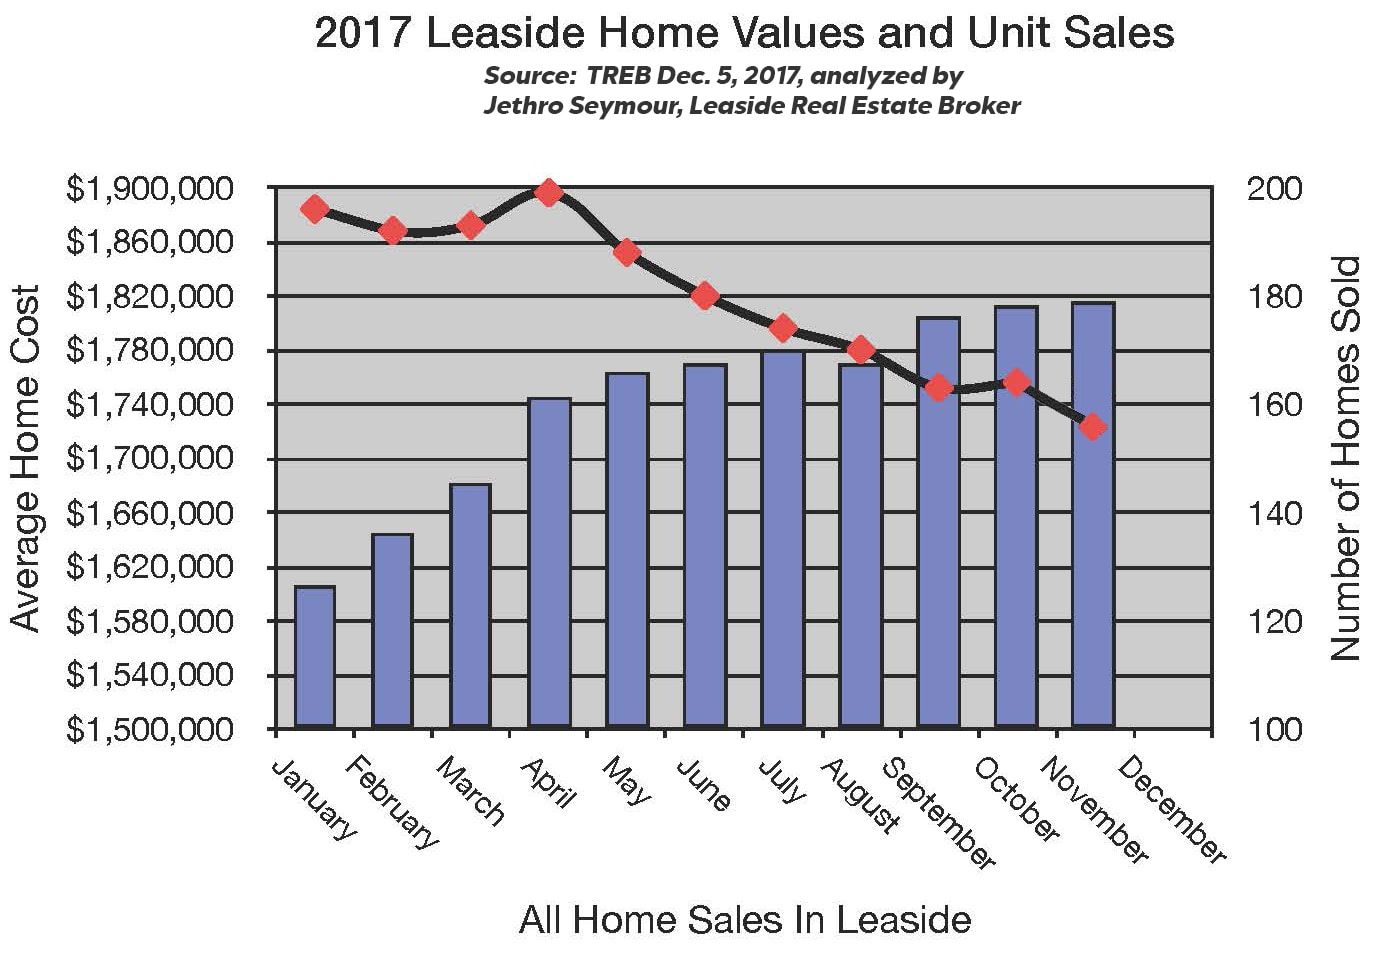
Here are the Leaside & Bennington Heights November 2017 home sales statistics.
Leaside & Bennington Heights home values up 16.4% over last year!
Sales Volume Changes*
All homes - down 20.3% to 157
Detached - down 19.9% to 121
Semis - down 7.9% to 35
Dollar Value Changes*
All homes - up 16.4% to $1,851,282
Detached - up 19.5% to $2,039,727
Semis - up 5.8% to $1,221,980
*MLS 12-month year-over-year changes ending November 30, 2017; Provided by Jethro Seymour

Low inventory levels continue to drive Leaside home values. Now is a great time to sell your Leaside home.
Monthly Update
Eleven homes changed hands in Leaside & Bennington Heights in November, a 38.9% decrease from last year. There were eight detached home sales last month, representing a 33.3% decrease from the past year’s 12 sales, while the semis decreased by 50% from the past year’s six sales. The average dollar values of those November detached and semi-detached homes, however, increased to $2,172,500 or 22.7% and $1,336,667 or 19.2%, respectively.
Yearly Update
The average value of 2017’s year-to-date 151 homes is up 16.8% or $1,864,922 compared to the 192 homes that sold in the first eleven months of 2016. Of those homes, 116 detached homes saw a 20% gain in average value over homes that traded in the first eleven months of 2016.
Consider me your neighbourhood real estate expert and resource. When it is time to move, I am here to help with insightful strategies, expert negotiation skills and results-focused marketing plans.


November Sales in
Leaside & Bennington Heights
| Semi-Detached | No. of Sold | Avg. Price | % of List Price | Days on Market |
| 3 Bedroom | 2 | $1,275,000 | 105% | 2 |
4 Bedroom | 1 | $1,460,000 | 106% | 9 |
| Detached | No. of Sold | Avg. Price | % of List Price | Days on Market |
| 2 Bedroom | 1 | $1,275,000 | 102% | 5 |
| 3 Bedroom | 4 | $1,917,500 | 101% | 9 |
| 4 Bedroom | 3 | $2,811,667 | 96% | 21 |
Source: TREB, MLS December 5, 2017
View home sales statistics for October 2017 here.
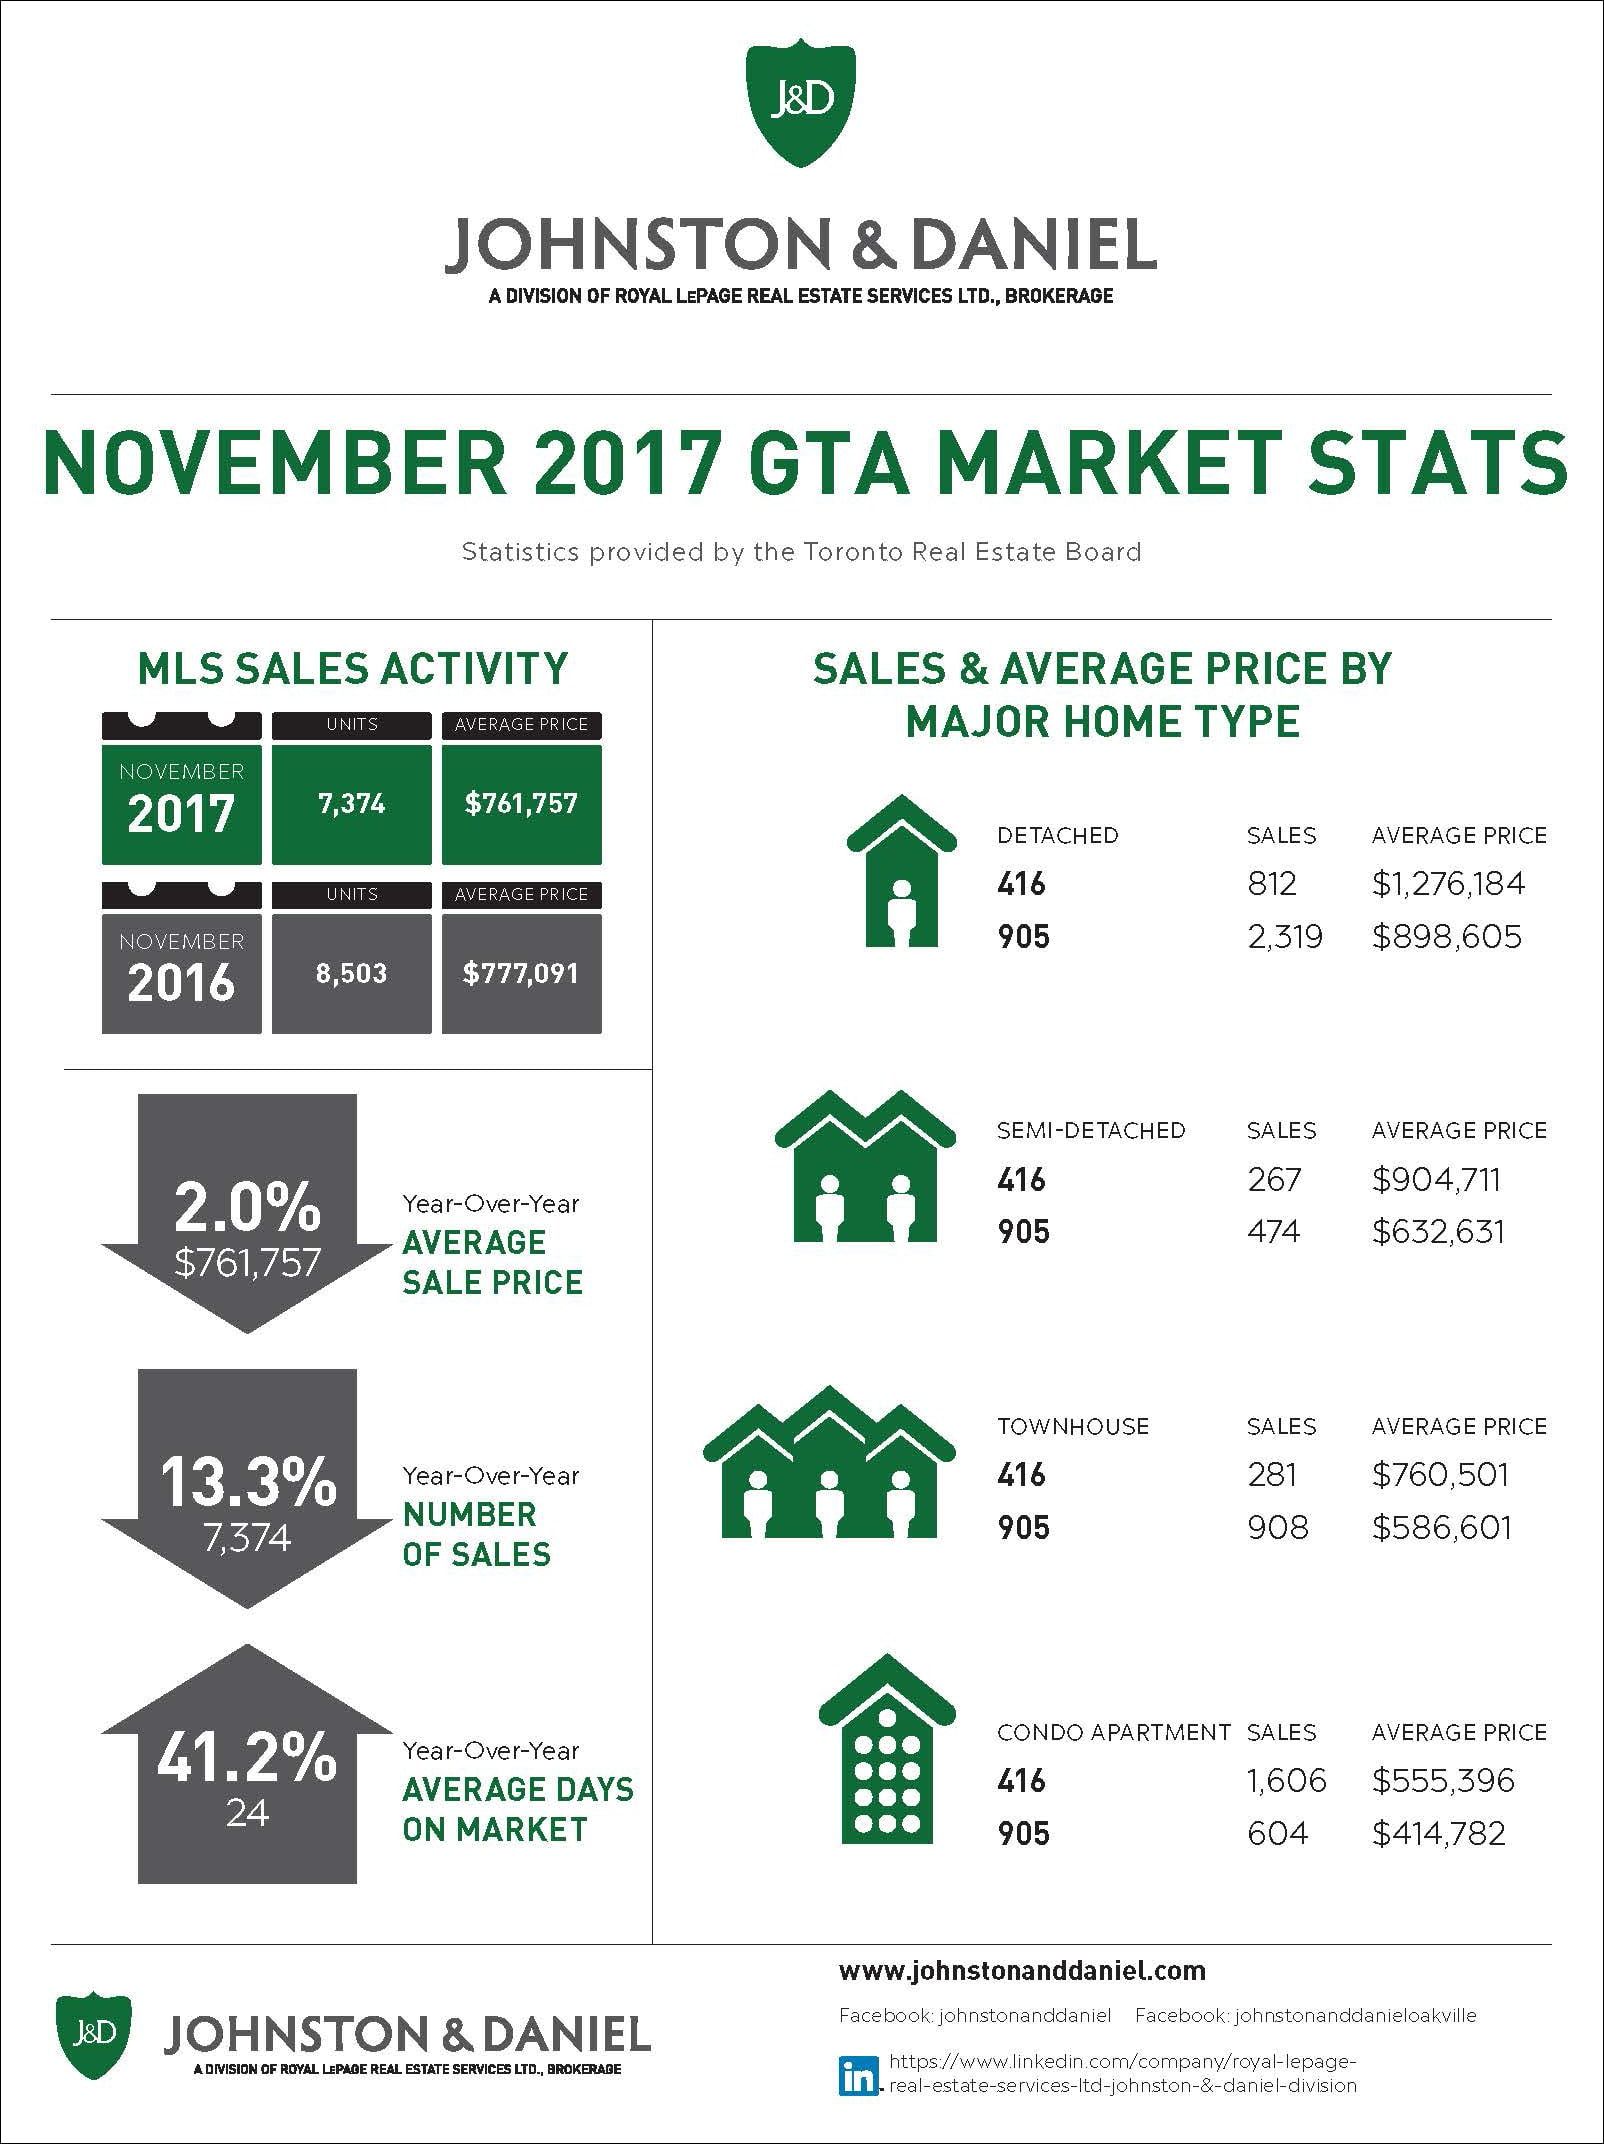
GTA Market Update
Jethro Seymour, one of the Top Davisville Village Real Estate Brokers at Royal LePage RES Ltd., Johnston & Daniel Division .
Jethro is a midtown Toronto residential specialist with over 20 years of sales experience in real estate, marketing, construction and publishing. He has helped many families find homes in Toronto’s great neighbourhoods, and has extensive knowledge of local markets, new home construction, resale home sales, and the condo market. Living in midtown Toronto, Jethro previews many of the homes that come to market for his clients and inventory knowledge. Jethro specializes in Midtown, Davisville Village and Leaside neighbourhoods.