
Market update
Moore Park Home Sales Statistics for October 2026 by Jethro Seymour, Top Midtown Toronto Real Estate Broker
View Moore Park September 2026 Home Sales View Other Neighbourhood Sales Statistics Talk to our Moore Park Expert
Market Report — October 2026
Sales Pick Up,
Homes Move Quickly
Moore Park saw a noticeable increase in activity in October, with 8 homes sold, up from 2 in September and 3 a year ago. Homes also found buyers faster, averaging just 15 days on the market, compared with 23 last October.
The average sale price was $2,452,176, down 18% year over year. While the monthly figure reflects a mix of six detached and two semi-detached sales, the longer-term averages also remain lower, with the year-to-date average down 7.2% and the 12-month rolling average down 7.4%.
Despite the pickup in sales, six of the eight homes sold below asking. With only six properties currently available, Moore Park is showing signs of a tighter market, but buyers are still negotiating.
Making a move in Moore Park? The Seymour Team can help you make sense of the numbers and plan your next move. → Talk to our Moore Park Expert
Missed the September recap?
Read the September 2026 Moore Park Market Report here
Sales Price
vs. Oct 2025
on Market
Source: TRREB MLS® sales data, Moore Park, October 1–31, 2026;
statistics by Jethro Seymour, Broker of Record.
October 2026 · 8 homes sold
What Sold in Moore Park
Click a home to see its address, sold price and days on market.
- Rose Park DriveDetached · 4 bedrooms
- Rosedale Heights DriveDetached · 5 bedrooms
- Clifton RoadDetached · 4 bedroomsSold by The Seymour Team
- Welland AvenueDetached · 5 bedrooms
- St Clair Avenue EDetached · 4+1 bedrooms
- Hudson DriveDetached · 4+1 bedrooms
- Rose Park DriveSemi-Detached · 4+1 bedrooms
- Moore AvenueSemi-Detached · 3+1 bedrooms
Free, no obligation.
Sold prices are shown to signed-in users only, under the MLS® rules that govern this information.
Listing information is deemed reliable but is not guaranteed accurate by PropTx or the Toronto Regional Real Estate Board. Data source: PropTx. Listings are refreshed from the MLS® at least daily.
The information provided herein must only be used by consumers that have a bona fide interest in the purchase, sale, or lease of real estate and may not be used for any commercial purpose or any other purpose.
Market Overview
Inventory Drops Sharply
in Moore Park
Moore Park entered November with just 6 homes for sale, down from 13 at the beginning of October. Four were newly listed in the past 30 days, while only two had been on the market longer. Against October’s eight sales, that represents just 0.75 months of inventory, a significant drop from 13 months in September.
This puts Moore Park firmly in seller’s market territory, with limited options for buyers. Still, six of October’s eight sales closed below asking, showing that low inventory doesn’t eliminate the importance of price. Buyers are moving quickly when the right opportunity comes along, but they aren’t necessarily paying a premium.
Sold at or above asking
- At or above asking 2 of 8 (25%)
- Below asking 6
Source: TRREB MLS® data, Moore Park, to November 1, 2026;
statistics by Jethro Seymour, Broker of Record.
Pricing Trends
Monthly Prices Shift,
Longer-Term Values Ease
October’s average sale price was $2,452,176, down 18% from a year ago. Detached homes averaged $2,765,569 across six sales, down 7.5%, while the two semi-detached sales averaged $1,512,000.
The broader trend remains softer. Year to date, 35 homes sold at an average of $3,190,776, down 7.2% year over year. The 12-month rolling average was $3,156,268, down 7.4%.
While October’s results reflect a relatively small sample, both longer-term measures point to prices remaining below last year’s levels.
- Same period last year
- This year
Changes are year over year. Source: TRREB MLS® sales data, Moore Park, to October 31, 2026;
statistics by Jethro Seymour, Broker of Record.
Speed of Sale
Just 15 Days
From Listing to Sale
Homes sold in an average of 15 days in October, down from 23 days last year, a 34.8% improvement.
Detached homes averaged 16 days on the market, while semi-detached homes averaged just 13 days. Both figures point to quicker transactions, although individual results still vary depending on pricing, property condition and buyer demand.
October 2026
October 2025
Source: TRREB MLS® sales data, Moore Park, October 1–31, 2026 and 2025;
statistics by Jethro Seymour, Broker of Record.
Feature Sales
Two Standouts,
Different Price Points
Highest Sale: Rosedale Heights Drive
- Property type: Detached, 2½-storey
- Lot size: 57.4 × 130 ft
- Bedrooms / bathrooms: 5 bed / 4 bath
- Size: about 3,000–3,500 sq ft
This Rosedale Heights Drive detached sold for $3,726,411, at 88.8% of its asking price, in 31 days.
Second-Highest Sale: Hudson Drive
- Property type: Detached, 2-storey
- Lot size: 40 × 132 ft
- Bedrooms / bathrooms: 4+1 bed / 4 bath
- Size: about 2,000–2,500 sq ft
This Hudson Drive detached sold for $3,252,000, at 95.6% of its asking price, in 9 days.
Both homes sold on their first listing. Their prices and selling times differed, at 31 days and 9 days on the market, but each found a buyer.
What This Means
Advice for Buyers & Sellers
For Buyers
With just six homes available, choices are limited. Six of October’s eight sales closed below asking, however, suggesting that negotiation remains possible. Pay attention to the two listings that have been on the market for more than 30 days, while being prepared to act when a well-priced property comes along.
For Sellers
Limited inventory and faster selling times create favourable conditions for sellers. However, six October sales still closed below asking, and the longer-term price averages remain lower. Recent comparable sales, property condition and the competition for buyers should guide your pricing strategy from the outset.
Thinking About Selling in Moore Park?
What could your home sell for right now? The answer depends on more than the neighbourhood average. Recent comparable sales, competing listings, property features and buyer demand all play a part. Jethro Seymour brings local market knowledge and a data-driven approach to help you understand your home’s position and plan your next move.
Curious about your home’s value?
Summary
Key Takeaways — October 2026
Changes are year over year
Compared with the 12 months before
Semi-detached: $1,765,738
January 1 to October 31, 2026
October 2026 Sales Breakdown
| Bedrooms | Sold | Avg. price | % of list | Days on market |
|---|---|---|---|---|
| 4 bedroom | 2 | $2,262,500 | 100% | 5 |
| 5 bedroom | 4 | $3,017,103 | 93% | 21 |
| Bedrooms | Sold | Avg. price | % of list | Days on market |
|---|---|---|---|---|
| 4 bedroom | 1 | $1,525,000 | 102% | 3 |
| 5 bedroom | 1 | $1,499,000 | 94% | 23 |
12-Month Price Average
- Homes sold, 12-month rolling (left)
- Average price, 12-month rolling (right)
See the figures
| 12 months to | Homes sold | Avg. price |
|---|---|---|
| Nov 2025 | 44 | $3,393,292 |
| Dec 2025 | 44 | $3,393,292 |
| Jan 2026 | 43 | $3,439,415 |
| Feb 2026 | 42 | $3,397,615 |
| Mar 2026 | 44 | $3,360,792 |
| Apr 2026 | 43 | $3,561,387 |
| May 2026 | 37 | $3,386,008 |
| Jun 2026 | 33 | $3,327,131 |
| Jul 2026 | 33 | $3,309,931 |
| Aug 2026 | 33 | $3,267,538 |
| Sep 2026 | 33 | $3,311,841 |
| Oct 2026 | 38 | $3,156,268 |
Each bar and point is the 12 months ending that month; the 12 months to October 2025 had 45 homes sold at an average of $3,408,796. Source: TRREB MLS® sales data to October 31, 2026;
statistics by Jethro Seymour, Broker of Record.
Zooming Out
A Busier Month,
A Softer Year
October brought a welcome pickup in Moore Park activity, with eight sales and an average selling time of just 15 days. But the broader picture is less encouraging: 38 homes sold over the past 12 months, down 15.6% from the previous year, while the average price declined 7.4% to $3,156,268.
The sharp drop in available inventory has shifted conditions in favour of sellers, but lower longer-term prices and the fact that most October sales closed below asking show that buyers remain selective.
Homes sold* ▼ 15.6%
- All homesdown 15.6%to 38 homes sold
- Detacheddown 19.5%to 33 homes sold
- Semi-detachedup 33.3%to 4 homes sold
Average price* ▼ 7.4%
- All homesdown 7.4%to $3,156,268
- Detacheddown 5%to $3,365,437
- Semi-detacheddown 17.3%to $1,722,691
*MLS 12-month year-over-year changes ending October 31, 2026; Provided by Jethro Seymour
Take the Next Step
Thinking About Your
Next Move in Moore Park?
Jethro Seymour knows Midtown Toronto and the numbers behind the market.
What is your home worth? Online estimates only tell part of the story.
Homes for sale in Moore Park
More from Moore Park
Moore Park
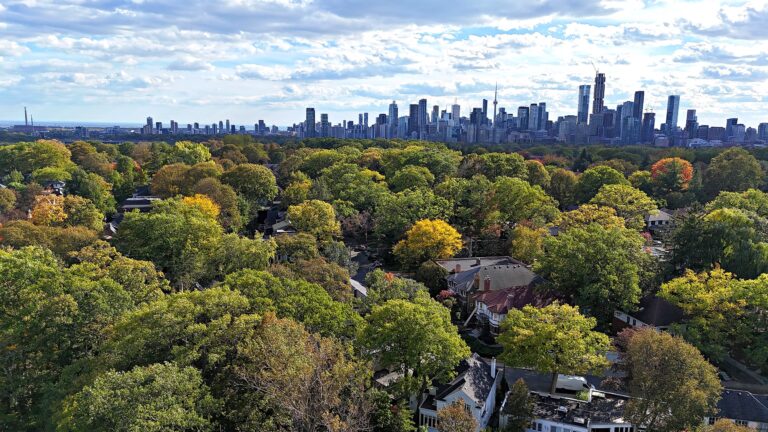
Moore Park is among the most distinctive and desirable districts in Toronto.
See Moore Park
Market update
Moore Park Home Sales Statistics for September 2026
Moore Park Home Sales Monthly Statistics | Top Midtown Toronto Realtor Jethro Seymour – The Seymour Team. Expert in Moore Park, Leaside, Davisville, Lawrence Park, Chaplin Estates & luxury homes. Buy or…
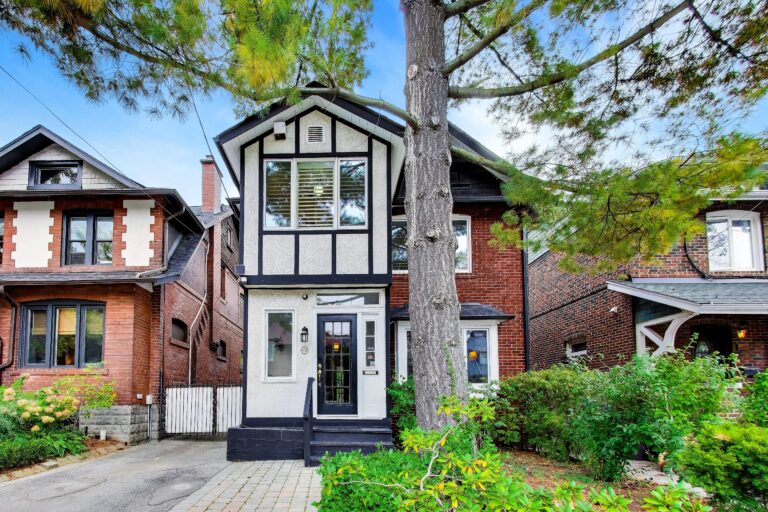
105 Clifton RoadRd
Detached · Toronto, ON · Moore Park
Moore Park
4+1 beds · 4 baths