
Market update
Moore Park Home Sales Statistics for September 2026
View Moore Park June 2026 Home Sales View Other Neighbourhood Sales Statistics Talk to Jethro about Moore Park
Market Report — September 2026
One Sale,
and It Went Fast
September was the quietest kind of month in Moore Park: one sale. A detached home on Clifton Rd sold for $1,710,000 in just 3 days, at 114% of its asking price. A year ago, two homes sold.
But a single sale can’t tell the whole story. The monthly average of $1,710,000 is down 38.4% year-over-year — a number that says more about one home than about Moore Park. Look beyond the month, however, and the picture is steadier: the year-to-date average is down 4%, and the 12-month rolling average is down 2%.
In other words: a thin month, but prices are close to where they were a year ago.
Missed the June recap?
Read the June 2026 Moore Park Market Report here
Sales Price
Change YoY
on Market
Source: TRREB MLS® sales data, Moore Park, September 1–30, 2026;
statistics by Jethro Seymour, Broker of Record.
Market Overview
Thirteen Homes
to Choose From
September left buyers with plenty to consider. There were 13 active listings on October 1st, with 5 of them new within the past 30 days. Against a single sale, that’s about 13 months of inventory — a figure that swings widely when so few homes sell in a month.
And the most telling number may be this: 8 of the 13 active listings have been sitting for more than 30 days. Buyers have time to compare, while the one home priced to move sold in three days.
Sold at or above asking
- At or above asking 1 of 1 (100%)
- Below asking 0
Source: TRREB MLS® data, Moore Park, to October 1, 2026;
statistics by Jethro Seymour, Broker of Record.
Pricing Trends
One Sale Can’t
Set the Price
September’s headline price needs context. The month’s one sale, on Clifton Rd, sold for $1,710,000. A year ago, two homes sold at an average of $2,774,000. With one or two sales, the monthly average reflects the homes that happened to sell, not the market as a whole.
The broader measures tell a steadier story. Through September, Moore Park has recorded 26 sales at an average of $3,336,914, down 4% year-over-year. The 12-month rolling average sits at $3,249,711, down 2%. Entry into Moore Park still runs approximately $1,800,000 for a semi-detached or a detached home.
- September 2026
- Longer measures
Changes are year over year. Source: TRREB MLS® sales data, Moore Park, to September 30, 2026;
statistics by Jethro Seymour, Broker of Record.
Speed of Sale
Buyers Are Moving —
When the Price Is Right
September’s one sale took just 3 days. A year ago, the month’s two sales averaged 5 days.
Over the past 12 months, Moore Park homes have averaged 15 days on market, against 16 a year earlier — a steady pace, even as fewer homes have sold.
The simpler takeaway? When a Moore Park home is priced to the market, it still sells fast.
- September 2026
- September 2025
All of Moore Park’s sales in both months were detached homes.
Source: TRREB MLS® sales data, Moore Park, September 1–30, 2026;
statistics by Jethro Seymour, Broker of Record.
Feature Sales
Clifton Rd —
Sold in Three Days
Clifton Rd — $1,710,000
- Property type: Detached
- Lot size: 50 × 55 ft
- Bedrooms / bathrooms: 3 bed / 4 bath
- Days on market: 3
- Sold for: 114% of its asking price
The month’s only sale went well above asking within days of listing.
A three-day sale at 114% of asking, in a month with 13 homes to choose from, is a reminder that the right price at launch still draws competition.
What This Means
Advice for Buyers & Sellers
For Buyers
Thirteen homes are for sale, and eight have been listed for more than a month. Buyers have room to compare and to negotiate — but a well-priced home can still sell in days, as Clifton Rd showed.
For Sellers
Demand is there for the right home: September’s one sale went for 114% of asking in three days. The caution is that most of Moore Park’s active listings are taking longer. Price it right from the first day, and buyers will still act quickly.
Making a move in Moore Park?
Summary
Key Takeaways — September 2026
Absorption rate 7.7%
September was thin on sales, but the longer-run averages show prices close to last year’s.
Fewer homes are changing hands — the ones priced well still sell quickly.
September 2026 Sales Breakdown
| Bedrooms | Sold | Avg. price | % of list | Days on market |
|---|---|---|---|---|
| 3 bedroom | 1 | $1,710,000 | 114% | 3 |
12-Month Price Average
- Homes sold, 12-month rolling (left)
- Average price, 12-month rolling (right)
See the figures
| 12 months to | Homes sold | Avg. price |
|---|---|---|
| Oct 2025 | 45 | $3,408,796 |
| Nov 2025 | 44 | $3,393,292 |
| Dec 2025 | 44 | $3,393,292 |
| Jan 2026 | 43 | $3,439,415 |
| Feb 2026 | 42 | $3,397,615 |
| Mar 2026 | 44 | $3,360,792 |
| Apr 2026 | 43 | $3,561,387 |
| May 2026 | 37 | $3,386,008 |
| Jun 2026 | 32 | $3,385,804 |
| Jul 2026 | 33 | $3,309,931 |
| Aug 2026 | 33 | $3,267,538 |
| Sep 2026 | 32 | $3,249,711 |
Source: TRREB MLS® sales data to September 30, 2026;
statistics by Jethro Seymour, Broker of Record.
Zooming Out
Fewer Sales,
Prices Close to Last Year
Over the past 12 months, the rolling sales count has eased to 32 homes, down 31.9% from 47 a year earlier, while the rolling average price has slipped 2% to $3,249,711.
Detached homes, which account for most sales, averaged $3,384,000, down 3%. The two semi-detached sales averaged $1,933,383, up 2.7%.
That’s the shape of Moore Park this fall: fewer transactions, and prices close to where they were. For sellers, it rewards realistic pricing. For buyers, it creates room to be selective rather than reactive.
Moore Park is quieter, and its prices are holding close to last year’s.
- Sept 2026
- Sept 2025
Sales volume* ▼ 31.9%
- All homes – down 31.9% to 32 homes sold
- Detached – down 31% to 29 homes sold
- Semi-detached – down 50% to 2 homes sold
Dollar value* ▼ 2%
- All homes – down 2% to $3,249,711
- Detached – down 3% to $3,384,000
- Semi-detached – up 2.7% to $1,933,383
*MLS 12-month year-over-year changes ending September 30, 2026; Provided by Jethro Seymour
Take the Next Step
Ready to Make Your
Move in Moore Park?
Whether you’re buying or selling, Jethro Seymour’s local expertise delivers results.
Thinking about selling? Find out what your Moore Park home is worth.
Homes for sale in Moore Park
More from Moore Park
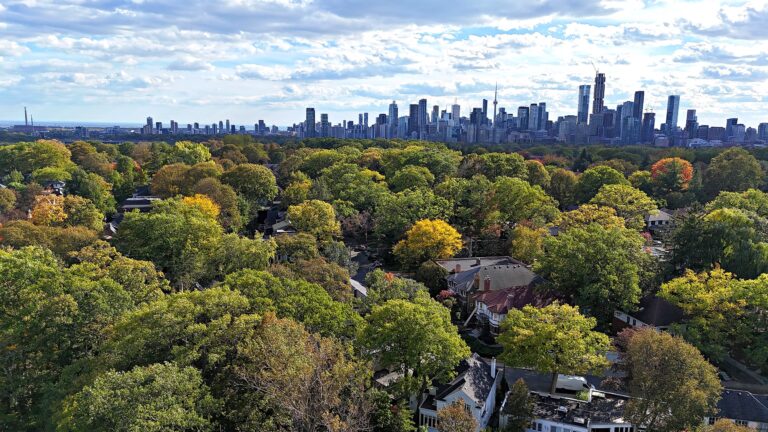
Moore Park
Moore Park is among the most distinctive and desirable districts in Toronto.
See Moore Park
Market update
Moore Park Home Sales Statistics for June 2026
Moore Park Home Sales Monthly Statistics | Top Midtown Toronto Realtor Jethro Seymour – The Seymour Team. Expert in Moore Park, Leaside, Davisville, Lawrence Park, Chaplin Estates & luxury homes. Buy or…
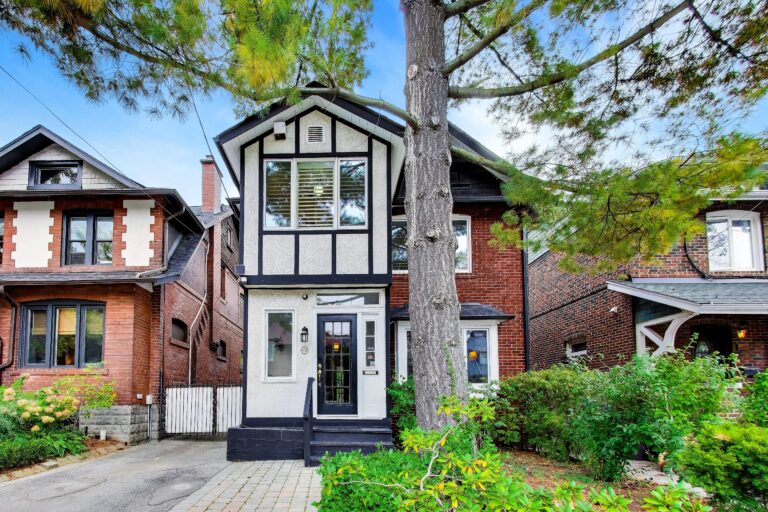
105 Clifton Road
Detached · Toronto, ON
Moore Park
4+1 beds · 4 baths