
Market update
Davisville Village Home Sales Statistics September 2026 from Jethro Seymour, Top Midtown Toronto Real Estate Broker
View Davisville Village August 2026 Home Sales View Other Neighbourhood Sales Statistics Talk to our Davisville Village Expert
Market Report — September 2026
Davisville Finds Its Fall Footing
September changed the tone of the Davisville market. After a very quiet August, 18 homes sold in September — the strongest monthly result of 2026, and 125% more than a year ago. Two-thirds sold at or above asking, and the average time on market was just 13 days.
But there’s another side to the story. The average sale price was $1,613,872, down 9.7% year-over-year. Look beyond the single month, however, and the picture is considerably steadier: the year-to-date average is up 5.1%, while the 12-month rolling average is up 3.7%.
In other words: buyers are back. Prices are holding. But they’re still being earned.
Missed the August recap?
Read the August 2026 Davisville Market Report here
Sales Price
Change YoY
on Market
Source: TRREB MLS® sales data, Davisville Village, September 1–30, 2026;
statistics by Jethro Seymour, Broker of Record.
Market Overview
More Listings. More Buyers.
Much Less Breathing Room.
September brought more homes to market — but buyers absorbed them almost as quickly. There were 23 active listings on October 1st, up from 16 in August, with another 17 new listings arriving throughout the month. Even with that increase in supply, Davisville ended September with just 1.28 months of inventory — firmly back in seller’s-market territory.
And the most telling number may be this: 12 of 18 sales closed at or above asking. That doesn’t mean every home is flying — six of the 23 active listings have been sitting for more than 30 days. But it does say something important: buyers are engaged again, and well-positioned homes are getting attention.
Sold at or above asking
- At or above asking 12 of 18 (66.7%)
- Below asking 6
Source: TRREB MLS® data, Davisville Village, to October 1, 2026;
statistics by Jethro Seymour, Broker of Record.
Pricing Trends
A Busy Market Doesn’t
Automatically Mean Higher Prices
September’s headline price decline needs some context. Detached homes accounted for seven sales — up a remarkable 250% year-over-year — but averaged $1,695,143, down 29.4%. Semi-detached homes were more consistent, with 11 sales averaging $1,562,153, just 1.4% below last year. That’s why a single month’s average can be misleading.
The broader measures tell a different story. Through September, Davisville has recorded 118 sales at an average of $1,776,725, up 5.1% year-over-year — both segments positive (detached +7.8%, semi +2.7%). The 12-month rolling average sits at $1,771,017, up 3.7% (detached +5.9%, semi +1%). So while September’s mix pulled the monthly average lower, the underlying market has continued to edge higher — more activity, modest price growth, and plenty of variation from one property to the next. Entry into Davisville still runs approximately $900,000 for semi-detached and $1,300,000 for detached.
- September 2026
- Longer measures
Changes are year over year. Source: TRREB MLS® sales data, Davisville Village, to September 30, 2026;
statistics by Jethro Seymour, Broker of Record.
Speed of Sale
Buyers Are Moving —
When the Price Is Right
Homes averaged 13 days on market in September, down from 18 days a year ago. Semi-detached homes were particularly quick, averaging just 9 days, unchanged from September 2025.
Detached homes took longer at 22 days, an 83.3% increase year-over-year. But September’s detached sales included an estate property that took several listing cycles to sell, so the headline number doesn’t necessarily signal a broad slowdown.
The simpler takeaway? Good homes at realistic prices are still moving quickly.
- September 2026
- September 2025
Source: TRREB MLS® sales data, Davisville Village, September 1–30, 2026 and 2025;
statistics by Jethro Seymour, Broker of Record.
Feature Sales
Two Sales.
Two Very Different Lessons.
Highest Sale: Belcourt Road
- Property type: Detached, 3-storey
- Lot size: 50 × 125 ft
- Bedrooms / bathrooms: 6 bed / 3 bath
- Size: 2,503 sq ft above grade
This Belcourt Road farmhouse ultimately sold for $2,290,000, after more than five months on and off the market and three separate listings. Its final sale price was roughly 21% below the original $2,895,000 asking price.
Seymour Team Listing: Belsize Drive
- Belsize Drive: Semi-detached, 2-storey, 20 × 125 ft, 3+1 bed / 4 bath
Then there was a Seymour Team listing. Belsize Drive — listed at $1,989,000 — sold the same day for $2,150,000, 108% of asking.
One home, five months and three listings to sell. Another, gone the day it hit the market. The difference isn’t simply that one was a better property than the other — it’s a reminder that pricing determines how the market responds to a property from the moment it launches. And in a market where buyers are active but still selective, that matters.
What This Means
Advice for Buyers & Sellers
For Buyers
The window of easy negotiation that appeared in August has narrowed. With just 1.28 months of inventory and 67% of September sales closing at or above asking, buyers are once again competing for well-priced homes. That doesn’t mean every property deserves multiple offers — far from it: the six listings sitting 30+ days are evidence of that. The opportunity is in knowing which homes are genuinely well-positioned and which aren’t.
For Sellers
The good news is that demand has returned. The caution is that demand isn’t the same thing as unlimited pricing power. September’s detached numbers make that particularly clear: sales volume jumped 250%, while the average price fell 29.4%. Meanwhile, the Belsize Drive sale demonstrates what can happen when a home enters the market at a price buyers are prepared to act on.
The market is active again. It is not forgiving of overpricing.
Making a move in Davisville Village?
Summary
Key Takeaways — September 2026
Semi $1,562,153 ▼ 1.4%
A mix-driven pricing dip, year over year
Both segments positive
Year over year
Absorption rate 78.3%
September was more than a rebound — it reset the terms of engagement. Volume is back, inventory has tightened, and the longer-run averages confirm prices are still edging higher. But the month’s own numbers make the caveat impossible to miss: buyers are active, not indiscriminate, and pricing discipline is what separates a same-day sale from a five-month saga.
September 2026 Sales Breakdown
| Bedrooms | Sold | Avg. price | % of list | Days on market |
|---|---|---|---|---|
| 2 bedroom | 1 | $1,150,000 | 120% | 25 |
| 3 bedroom | 5 | $1,685,200 | 102% | 23 |
| 6 bedroom | 1 | $2,290,000 | 95% | 14 |
| Bedrooms | Sold | Avg. price | % of list | Days on market |
|---|---|---|---|---|
| 2 bedroom | 2 | $1,310,900 | 104% | 6 |
| 3 bedroom | 8 | $1,557,736 | 107% | 10 |
| 4 bedroom | 1 | $2,100,000 | 105% | 6 |
12-Month Price Average
- Homes sold, 12-month rolling (left)
- Average price, 12-month rolling (right)
See the figures
| 12 months to | Homes sold | Avg. price |
|---|---|---|
| Oct 2025 | 106 | $1,697,893 |
| Nov 2025 | 115 | $1,702,519 |
| Dec 2025 | 113 | $1,702,617 |
| Jan 2026 | 115 | $1,705,197 |
| Feb 2026 | 119 | $1,720,938 |
| Mar 2026 | 125 | $1,790,776 |
| Apr 2026 | 128 | $1,762,115 |
| May 2026 | 130 | $1,719,302 |
| Jun 2026 | 131 | $1,786,086 |
| Jul 2026 | 136 | $1,793,837 |
| Aug 2026 | 133 | $1,790,066 |
| Sep 2026 | 144 | $1,771,017 |
Source: TRREB MLS® sales data to September 30, 2026;
statistics by Jethro Seymour, Broker of Record.
Zooming Out
Davisville Is Busier. The Question Is How Long It Lasts.
September was more than a rebound from August. The 12-month rolling sales count has reached 144 homes, up 35.8% year-over-year, while the rolling average price has risen 3.7% to $1,771,017. That suggests the increase in activity isn’t simply a one-month blip.
At the same time, September reminds us not to mistake stronger volume for a return to the runaway market of years past. Buyers are active, but they remain price-conscious. Some homes attract immediate competition; others sit.
That may be the defining characteristic of this fall market: more buyers, more transactions, but still a meaningful gap between what sellers want and what buyers are willing to pay. For sellers, that makes preparation and pricing particularly important. For buyers, it creates an opportunity to be selective rather than reactive.
Davisville is moving again. The market is healthier, but it still has something to prove.
- Sept 2026
- Sept 2025
Sales volume* ▲ 35.8%
- All homes – up 35.8% to 144 homes sold
- Detached – up 32.7% to 69 homes sold
- Semi-detached – up 46% to 73 homes sold
Dollar value* ▲ 3.7%
- All homes – up 3.7% to $1,771,017
- Detached – up 5.9% to $2,086,417
- Semi-detached – up 1% to $1,465,927
*MLS 12-month year-over-year changes ending September 30, 2026; Provided by Jethro Seymour
Take the Next Step
Ready to Make Your
Move in Davisville?
Whether you’re buying or selling, Jethro Seymour’s local expertise delivers results.
Thinking about selling? Find out what your Davisville home is worth.
Homes for sale in Davisville Village
More from Davisville Village
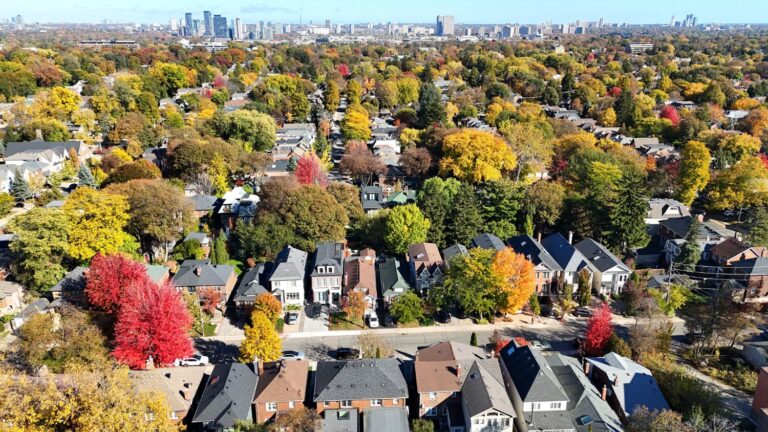
Davisville Village
Midtown Toronto’s Davisville Village is a vibrant, centrally located neighbourhood that offers a quiet, convenient alternative to downtown living.
See Davisville Village
Market update
Davisville Village Home Sales Statistics for August 2026 by Jethro Seymour Top Midtown Toronto Agent
Monthly home sales statistics for Davisville Village and Midtown Toronto — Leaside, Moore Park, Rosedale, Lawrence Park & Chaplin Estates. Average prices, days on market & trends. Updated monthly by Jethro Seymour,…


$1,048,000 12 days on market MLS® C14166556
350 Soudan Avenue
Semi-Detached · Toronto, ON · Davisville Village
Davisville Village
3 beds · 2 baths · 3 parking · 1100-1500 sq ft
1100-1500 sq ft
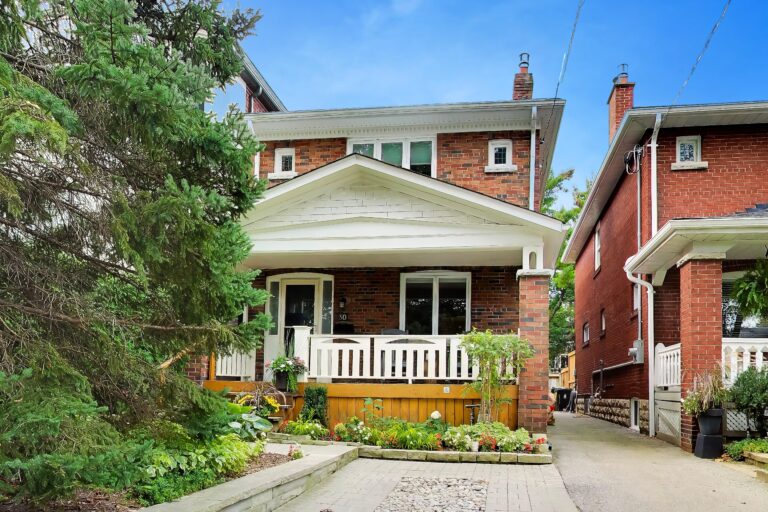
30 Harwood RoadRd
Detached · Toronto, ON · Davisville Village
Davisville Village
3 beds · 3 baths · 1 parking · 2,009 sq ft
2,009 sq ft