


Davisville Village Home Sales Statistics for August 2026 by Jethro Seymour Top Midtown Toronto Agent
Davisville in August 2026:
A Summer Surge Cools Off
By Jethro Seymour | The Seymour Team After a summer surge that peaked at 21 sales in June, Davisville cooled sharply in August — just 4 homes sold, down 50% from a year ago and half of July's already-slower pace. Zoom out, though, and the story underneath is more nuanced: the rolling 12-month trend continues to strengthen, one of our own Seymour Team listings on Belsize Dr sold in just 3 days at 107% of asking, and active inventory has started to build after months of tight supply. Of the 16 homes currently on the market, however, 10 have already been sitting for more than 30 days. As we head into fall, expect a more selective market rather than a return to the spring pace. Buyers have more choice, while sellers will need to get pricing right from the outset. Here's the full breakdown of what moved in August — and why the headline number only tells part of the story. Missed the July recap? Read the July 2026 Davisville Market Report here. Sales Price
Change YoY
on Market
Inventory Finally Starts to Build
Active inventory picked up in August. 16 active listings remained on the market as of September 1st — up from July's 15 — with 6 new listings entering the market during the month. At August's much slower pace of sales, that works out to 4.0 months of inventory, a sharp jump from July's razor-thin 1.2.- Active listings as of September 1st: 16
- New listings in August: 6
- Listings sitting 30+ days: 10
- Homes sold at or above asking: 2 of 4 (50%)
- Months of inventory: 4.0 — a more balanced market than July's tight 1.2
- Lowest active listing: $959,000 — Belsize Dr (detached bungalow, 17 DOM)
- Highest active listing: $3,680,000 — Carey Rd (detached, 134 DOM, relisted from $3,895,000)
A Thin Sample, A Steady Trend
August's all-homes average of $1,555,000 is down 15.0% year-over-year — but that figure comes from just 4 sales, the smallest monthly sample of the year, so it moves around easily. Detached pricing held essentially flat, down just 0.2% on a single $1,955,000 sale. Semi-detached pricing eased to $1,421,667 across 3 sales. Zoom out to the rolling 12-month numbers and the picture steadies considerably: all-homes pricing is still up 5.0% to $1,790,066, detached is up 10.0% to $2,138,075, and semi-detached is essentially flat at $1,459,015 (-0.2%) rather than genuinely down.Year-to-date, entry into the Davisville market still requires approximately $900K for semi-detached and $1.3M for detached — both thresholds unchanged from July.
Fewer Sales, But Fast Ones
Days on market averaged 14 in August — down sharply from a year ago (-48.1%) and in line with a rolling 12-month figure that's also quickening, down 6.3% year-over-year. Unlike some months, the monthly and rolling trends agree here: speed is genuinely up across the board.- Overall average: 14 days (rolling 12-month: 15 days, down 6.3% year-over-year)
- Detached homes: 15 days — the single Merton St sale (rolling detached: 14 days, down 12.5% year-over-year)
- Semi-detached homes: 13 days — led by Belsize Dr's 3-day sale; Mann Ave's 29 days only reflects its final listing cycle (rolling semi: 14 days, down 12.5% year-over-year)
The Month's Notable Transactions
August's two feature sales bookend the range of what happened this month — the highest-priced sale of the four, and a Seymour Team listing that moved in days.- Property type: Detached, 2-storey
- Lot size: 25 × 156 ft
- Bedrooms / bathrooms: 3+1 bed / 3 bath
- Days on market: 15
- Final sale price: $1,955,000
- Sold for: 98% of list price ($1,995,000)
- Property type: Semi-Detached, 2-storey
- Lot size: 23.17 × 125 ft
- Bedrooms / bathrooms: 3 bed / 3 bath
- Days on market: 3
- Final sale price: $1,605,000
- Sold for: 107% of list price ($1,499,000)
Advice for Buyers & Sellers
For Buyers With 16 active listings and 4.0 months of inventory, August offered the most breathing room buyers have had all year. Ten of those listings have sat beyond 30 days — including the Carey Rd relisting, now well off its original $3,895,000 ask — which is exactly where the negotiating room is. Entry into the market still starts at approximately $900K for semi-detached and $1.3M for detached. For Sellers Don't read August's quiet month as a signal to pull back — the rolling 12-month trend is still up 5.0% on price and 26.7% on volume. But the month does confirm that buyers now have more choice, and the gap between Belsize Dr (3 days, 107% of asking) and Mann Ave (29 days, 87%) shows exactly what separates a fast sale from a slow one. Heading into fall, expect a more selective market rather than a return to the spring pace — get pricing right from the outset, because overpricing will show up in days on market fast.Key Takeaways — August 2026
- 4 homes sold: 1 detached, 3 semi-detached — down from 21 in June's peak and 13 in July
- 2 of 4 homes (50%) sold at or above asking price
- Average sale price: $1,555,000 (Detached: $1,995,000 | Semi: $1,421,667)
- Monthly pricing: -15.0% year-over-year, on a thin 4-sale sample
- Rolling 12-month pricing: +5.0% to $1,790,066 (Detached +10.0% | Semi essentially flat, -0.2%)
- Pace quickened: 14 days overall (Detached: 15 days | Semi: 13 days) — rolling 12-month pace also down 6.3% year-over-year, in agreement
- 12-month rolling volume: 133 sales — up 26.7% year-over-year (Detached +18.9% | Semi +36.7%)
- Top sale: $1,955,000 on Merton St (98% of asking, 15 days)
- Notable sale: $1,605,000 on Belsize Dr — a Seymour Team listing (107% of asking, 3 days)
- Entry point: ~$900K semi / ~$1.3M detached (year-to-date, unchanged)
- Active listings September 1: 16 (10 sitting 30+ days) — 4.0 months of inventory, up from 1.2 in July
The Bigger Picture: Where Davisville Is Headed
Step back from any single month and the trajectory is still upward. Over the past 12 months, 133 homes changed hands in Davisville Village — up 26.7% from the year before — while the rolling average price rose 5.0% to $1,790,066. Year-to-date figures tell the same story: 99 homes sold through August, up 25.3% year-over-year, at an average of $1,802,060, up 7.3%. Detached is leading on price (+10.0% rolling, +11.8% YTD) while semi-detached volume continues to surge (+36.7% rolling, +33.3% YTD) even as semi pricing holds essentially flat. August's own numbers moved sharply against that backdrop — just 4 sales, the smallest month of the year, with pricing down 15.0% on the month. Worth being honest about: this isn't a base-effect illusion the way some single-metric swings can be. Volume genuinely fell off a cliff after June's 21-sale peak, and inventory genuinely built up, pushing months-of-inventory from 1.2 in July to 4.0 in August. That's a real shift in the month's supply-demand balance, even if it hasn't yet shown up in the rolling and YTD trend lines. Looking ahead: with buyers now holding more selection and sellers facing a more discerning market, expect September and October to reward accurate pricing over aspirational pricing. The Belsize Dr sale — 3 days, 107% of asking — is the clearest evidence that demand hasn't disappeared, it's just become choosier about where it lands.Ready to Make Your Move in Davisville?
Whether you're buying or selling, Jethro Seymour's local expertise delivers results.
Thinking about selling? Find out what your Davisville home is worth in today's market.
Get a Home Valuation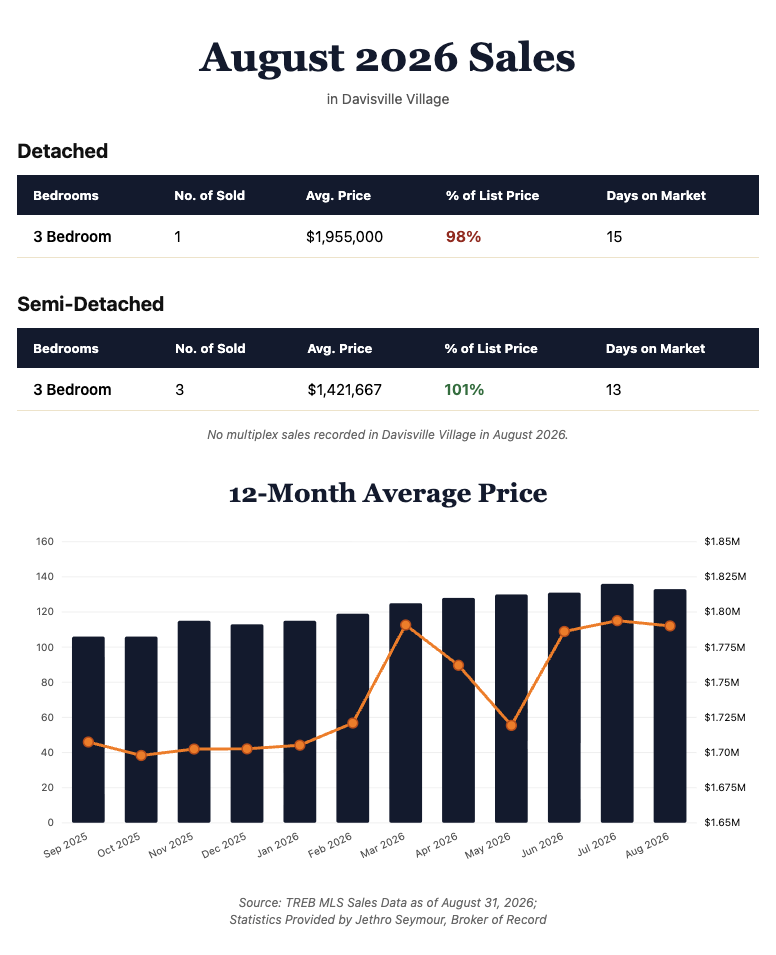
Search Homes For Sale in Davisville Village
Explore
Davisville Village
Previous Davisville Village
Home Sales Statistics
Davisville Village Home Sales Statistics for September 2026 by Jethro Seymour Top Midtown Toronto Agent
Monthly home sales statistics for Davisville Village and Midtown Toronto — Leaside, Moore Park, Rosedale, Lawrence Park & Chaplin Estates. Average prices, days on market & trends. Updated monthly by Jethro Seymour, Broker of Record.
Davisville Village Home Sales Statistics for July 2026 by Jethro Seymour Top Midtown Toronto Agent
Monthly home sales statistics for Davisville Village and Midtown Toronto — Leaside, Moore Park, Rosedale, Lawrence Park & Chaplin Estates. Average prices, days on market & trends. Updated monthly by Jethro Seymour, Broker of Record.
Davisville Village Home Sales Statistics for June 2026 by Jethro Seymour Top Midtown Toronto Agent
Monthly home sales statistics for Davisville Village and Midtown Toronto — Leaside, Moore Park, Rosedale, Lawrence Park & Chaplin Estates. Average prices, days on market & trends. Updated monthly by Jethro Seymour, Broker of Record.
Find Us in
Midtown Toronto
Royal LePage Terrequity
Seymour Real Estate
Toronto, ON M4P 1L3
Jethro Seymour is one of the Top Davisville Village Real Estate Brokers and a midtown Toronto residential specialist with over 20 years of sales experience in real estate, marketing, construction and publishing. He has helped many families find homes in Toronto’s great neighbourhoods, and has extensive knowledge of local markets, new home construction, resale home sales, and the condo market. Living in midtown Toronto, Jethro previews many of the homes that come to market for his clients and inventory knowledge. Jethro specializes in Midtown, Davisville Village, and Leaside neighbourhoods.