
Market update
Davisville Village Home Sales Statistics October 2026 from Jethro Seymour, Top Midtown Toronto Real Estate Broker
View Davisville Village September 2026 Home Sales View Other Neighbourhood Sales Statistics Talk to Jethro about Davisville Village
Market Report — October 2026
Same Number of Sales,
Nearly Half the Wait
October brought fewer sales to Davisville Village than September, but the homes that did sell weren’t sitting around. Eleven properties sold, matching last October, yet found buyers in an average of just 7 days, down from 13 days a year ago. Seven of the 11 sold at or above asking, showing that buyers are still willing to compete for the right home.
The average sale price was $1,853,031, down 3.8% year over year. But the longer-term picture is more positive, with the 12-month average up 3.9% and the year-to-date average up 3.8%.
Which homes are attracting the strongest interest, where are buyers finding room to negotiate, and what does it mean if you’re thinking of selling?
Making a move in Davisville Village? The Seymour Team can help you make sense of the numbers and plan your next move. → Talk to Jethro
Missed the September recap?
Read the September 2026 Davisville Market Report here
Sales Price
vs. Oct 2025
on Market
Source: TRREB MLS® sales data, Davisville Village, October 1–31, 2026 (the 11 include 1 townhouse);
statistics by Jethro Seymour, Broker of Record.
Market Overview
A Smaller Market,
Still Moving Quickly
19 homes are currently for sale in Davisville Village at the start of November, down from 23 last month. Eight came on the market in the last 30 days, and eleven have been listed longer than that. Set against October’s 11 sales, that is 1.73 months of inventory: the time it would take to sell every home now listed at October’s pace. September stood at 1.28 months. The market still favours sellers, though buyers have more room than they did in September.
Four sales closed below asking, and eleven homes have been listed past 30 days. Buyers are choosing with care.
Sold at or above asking
- At or above asking 7 of 11 (63.6%)
- Below asking 4
Source: TRREB MLS® data, Davisville Village, to November 1, 2026;
statistics by Jethro Seymour, Broker of Record.
Pricing Trends
A Few Sales
Can Move the Average
October’s average came in at $1,853,031, down 3.8% from last October, and the mix of homes did most of the work. Semi-detached homes averaged $1,850,890 across six sales, up 25%, helped by one sale at the very top of the month’s range. Without it, the semi average would have been $1,562,068, up 5.5%. Detached homes averaged $1,875,750 across four sales, down 18.3%, but last October’s bar was high: six detached homes averaged $2,295,458. With so few sales in each group, one home can shift a monthly figure a long way, and prices move up and down from month to month.
Year to date, 130 homes have sold at an average of $1,781,015, up 3.8% year-over-year (detached +4.3%, semi +4.8%). Over the last 12 months, 145 homes sold at an average of $1,763,627, up 3.9% (detached +5.4%, semi +4%). Both measures point to modest price growth over the longer term.
- This year
- Same period last year
Changes are year over year. Source: TRREB MLS® sales data, Davisville Village, to October 31, 2026;
statistics by Jethro Seymour, Broker of Record.
Speed of Sale
Quick Sales,
Faster Than Last October
Homes sold in 7 days on average in October, against 13 a year ago, a drop of 46.2%. Semi-detached homes averaged 6 days (9 a year ago, down 33.3%) and detached homes 10 days (17 a year ago, down 41.2%).
These are days on a home’s current listing, so a home relisted at a lower price looks quicker than it was. Its total time on the market is given alongside it where that applies.
October 2026
October 2025
Source: TRREB MLS® sales data, Davisville Village, October 1–31, 2026 and 2025;
statistics by Jethro Seymour, Broker of Record.
Feature Sales
Two Sales.
Two Different Paths.
Highest Sale: Thurloe Avenue
- Property type: Semi-detached, 3-storey
- Lot size: 24 × 125 ft
- Bedrooms / bathrooms: 3+1 bed / 5 bath
- Size: about 3,000–3,500 sq ft
This Thurloe Avenue semi-detached sold for $3,295,000 on October 31, at full asking, in 15 days.
Second-Highest Sale: Manor Road
- Property type: Detached, 2-storey
- Lot size: 25 × 123 ft
- Bedrooms / bathrooms: 4+1 bed / 4 bath
- Size: about 2,000–2,500 sq ft
Manor Road took a different route. It first listed in September 2026 at $2,999,999, then was relisted once, on October 13, at $2,899,000. It sold 1 day after the price change, for $2,800,000, 93.3% of the first asking price. Counting both listings, the home was on the market 27 days in total.
Two different outcomes, but a similar lesson: buyers respond when the price reflects what the market is prepared to pay.
What This Means
Advice for Buyers & Sellers
For Buyers
Seven of October’s 11 sales closed at or above asking, which shows that a well-priced home still draws competition. But with 11 current listings sitting beyond 30 days, buyers have room to be selective. Review a property’s listing history and any price adjustments before deciding how to offer.
For Sellers
October’s sales show how much the starting price can influence the outcome. Thurloe Avenue sold at full asking, while Manor Road found its buyer the day after being reduced. Understanding where your home fits among recent sales and competing listings is key to setting the right strategy.
Thinking About Selling in Davisville?
What could your home sell for right now? The answer depends on more than the neighbourhood average. Recent comparable sales, competing listings, property features and buyer demand all play a part. Jethro Seymour brings local market knowledge and a data-driven approach to help you understand your home’s position and plan your next move.
Curious about your home’s value?
Summary
Key Takeaways — October 2026
Semi $1,850,890 ▲ 25%
Changes are year over year
Detached and semi both up
Compared with the 12 months before
Semi-detached: $3,295,000
January 1 to October 31, 2026
Few homes for sale relative to buyer demand
October 2026 Sales Breakdown
| Bedrooms | Sold | Avg. price | % of list | Days on market |
|---|---|---|---|---|
| 3 bedroom | 2 | $1,641,500 | 98% | 12 |
| 4 bedroom | 1 | $1,420,000 | 120% | 13 |
| 5 bedroom | 1 | $2,800,000 | 97% | 1 |
| Bedrooms | Sold | Avg. price | % of list | Days on market |
|---|---|---|---|---|
| 3 bedroom | 2 | $1,699,671 | 106% | 2 |
| 4 bedroom | 3 | $1,968,667 | 108% | 8 |
| 5 bedroom | 1 | $1,800,000 | 100% | 6 |
12-Month Price Average
- Homes sold, 12-month rolling (left)
- Average price, 12-month rolling (right)
See the figures
| 12 months to | Homes sold | Avg. price |
|---|---|---|
| Nov 2025 | 115 | $1,702,519 |
| Dec 2025 | 113 | $1,702,617 |
| Jan 2026 | 115 | $1,705,197 |
| Feb 2026 | 119 | $1,720,938 |
| Mar 2026 | 125 | $1,790,776 |
| Apr 2026 | 128 | $1,762,115 |
| May 2026 | 130 | $1,719,302 |
| Jun 2026 | 131 | $1,786,086 |
| Jul 2026 | 136 | $1,793,837 |
| Aug 2026 | 133 | $1,790,066 |
| Sep 2026 | 144 | $1,771,017 |
| Oct 2026 | 145 | $1,763,627 |
Each bar and point is the 12 months ending that month; the 12 months to October 2025 had 106 homes sold at an average of $1,697,893. Source: TRREB MLS® sales data to October 31, 2026;
statistics by Jethro Seymour, Broker of Record.
Zooming Out
A Stronger Year, A Steadier Fall
October was quieter than September, but the broader picture remains encouraging. Sales are up over the past year, average prices are higher than they were a year ago, and well-priced homes are still finding buyers quickly.
The market isn’t moving at the same pace for every property. Buyers are selective, and the gap between a well-positioned listing and one that misses the mark can be significant.
In Davisville, understanding the market is one thing. Knowing how to position your home within it is what makes the difference.
Homes sold* ▲ 36.8%
- All homesup 36.8%to 145 homes sold
- Detachedup 25.9%to 68 homes sold
- Semi-detachedup 48%to 74 homes sold
Average price* ▲ 3.9%
- All homesup 3.9%to $1,763,627
- Detachedup 5.4%to $2,046,882
- Semi-detachedup 4%to $1,496,108
*MLS 12-month year-over-year changes ending October 31, 2026; Provided by Jethro Seymour
Take the Next Step
Thinking About Your
Next Move in Davisville?
Jethro Seymour knows Midtown Toronto and the numbers behind the market.
What is your home worth? Online estimates only tell part of the story.
Homes for sale in Davisville Village
More from Davisville Village
Davisville Village
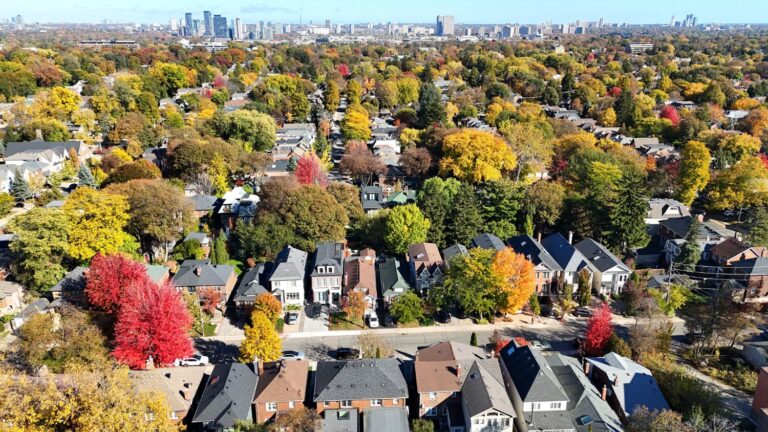
Midtown Toronto’s Davisville Village is a vibrant, centrally located neighbourhood that offers a quiet, convenient alternative to downtown living.
See Davisville Village
Market update
Davisville Village Home Sales Statistics September 2026 from Jethro Seymour, Top Midtown Toronto Real Estate Broker
Monthly home sales statistics for Davisville Village and Midtown Toronto — Leaside, Moore Park, Rosedale, Lawrence Park & Chaplin Estates. Average prices, days on market & trends. Updated monthly by Jethro Seymour,…


$679,000 20 days on market MLS® C14030278
202 - 1750 Bayview Avenue
Condo Apartment · Toronto, ON · Davisville Village
Davisville Village
2 beds · 2 baths · 1 parking · 900-999 sq ft
900-999 sq ft · $1,042/month maintenance
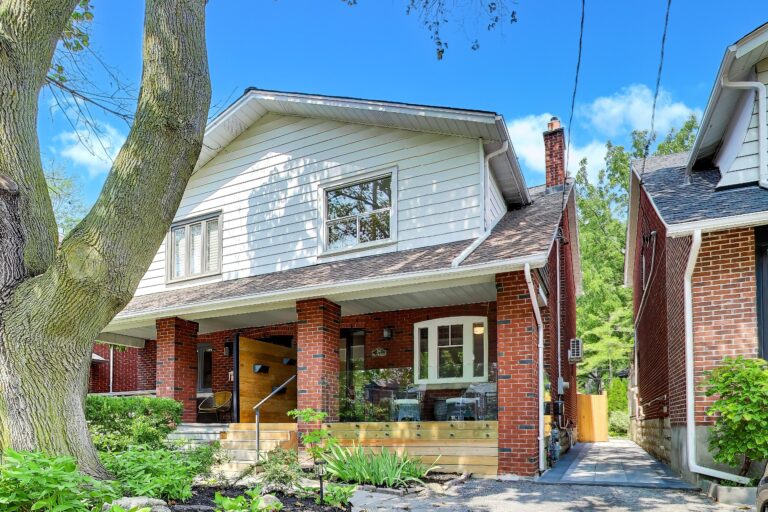
262 Belsize DriveDr
Semi-detached · Toronto, ON · Davisville Village
Davisville Village
3 beds · 3 baths · 1,934 sq ft
1,934 sq ft