
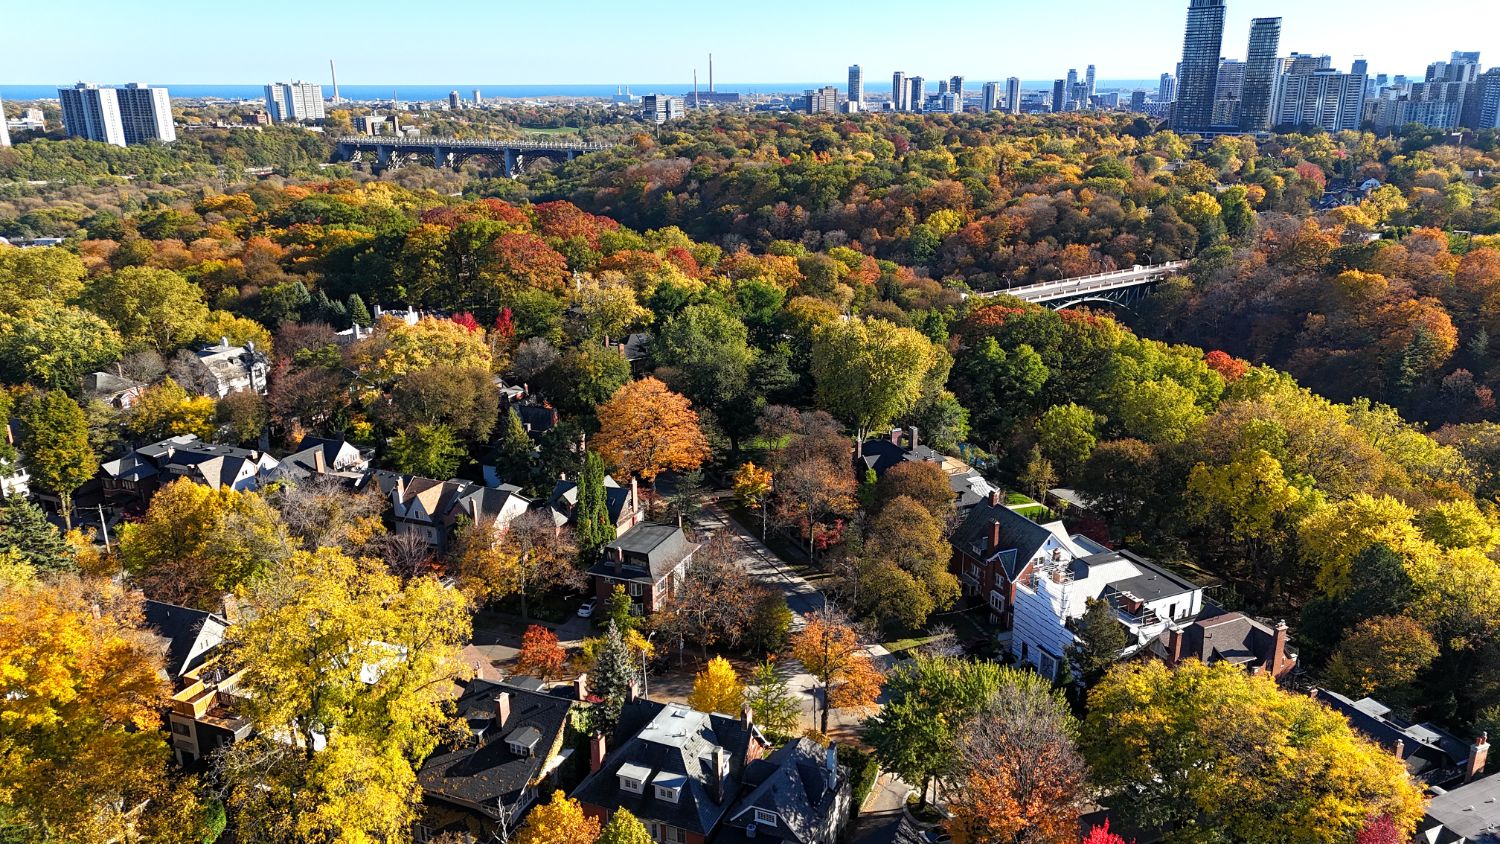
Market update
Rosedale Home Sales Statistics for October 2026 by Jethro Seymour Top Midtown Toronto Real Estate Broker
View Rosedale September 2026 Home Sales View Other Neighbourhood Sales Statistics Talk to our Rosedale Expert
Market Report — October 2026
Sales Climb,
Inventory Tightens
Fourteen homes sold in Rosedale in October, more than double the six sales recorded a year ago and up from five in September. Homes also sold faster, averaging 22 days on the market, compared with 41 days last October. Only one of the 14 sales closed at or above asking.
The average sale price was $4,284,179, down 37.1% year over year. Longer-term figures show a more moderate decline, with the year-to-date average down 11.6% and the 12-month rolling average down 16.2%.
Which properties are attracting buyers, where is there room to negotiate, and what should sellers consider before entering the market?
Making a move in Rosedale? The Seymour Team can help you interpret the latest numbers and plan your next step. → Talk to our Rosedale Expert
Missed the September recap?
Read the September 2026 Rosedale Market Report here
Sales Price
vs. Oct 2025
on Market
Source: TRREB MLS® sales data, Rosedale, October 1–31, 2026;
statistics by Jethro Seymour, Broker of Record.
October 2026 · 14 homes sold
What Sold in Rosedale
Click a home to see its address, sold price and days on market.
- Maple AvenueDetached · 4+2 bedrooms
- Roxborough DriveDetached · 6+1 bedrooms
- Glen RoadDetached · 5+1 bedrooms
- Crescent RoadDetached · 6 bedrooms
- Glen RoadDetached · 4+1 bedrooms
- Roxborough Street EDetached · 5 bedrooms
- Astley AvenueDetached · 4 bedrooms
- Sherbourne Street NSemi-Detached · 5+1 bedrooms
- Glen RoadSemi-Detached · 2+1 bedrooms
- Pine Hill RoadDetached · 5 bedrooms
- Jean StreetDetached · 4 bedrooms
- Glen RoadSemi-Detached · 3 bedrooms
- Glen RoadDetached · 5+1 bedrooms
- Mathersfield DriveSemi-Detached · 3+1 bedrooms
Free, no obligation.
Sold prices are shown to signed-in users only, under the MLS® rules that govern this information.
Listing information is deemed reliable but is not guaranteed accurate by PropTx or the Toronto Regional Real Estate Board. Data source: PropTx. Listings are refreshed from the MLS® at least daily.
The information provided herein must only be used by consumers that have a bona fide interest in the purchase, sale, or lease of real estate and may not be used for any commercial purpose or any other purpose.
Market Overview
Fewer Listings,
Less Choice for Buyers
Rosedale had 37 active listings at the start of November, down from 47 at the beginning of October. Ten were listed in the past 30 days, while 27 had been on the market longer. Compared with October’s 14 sales, that represents 2.64 months of inventory, a substantial drop from September’s 9.4 months.
The lower inventory points to a market that currently favours sellers. However, with 13 of October’s 14 sales closing below asking, buyers are still negotiating. The number of listings that have been on the market for more than 30 days also suggests that not every property is finding an immediate audience.
Sold at or above asking
- At or above asking 1 of 14 (7.1%)
- Below asking 13
Source: TRREB MLS® data, Rosedale, to November 1, 2026;
statistics by Jethro Seymour, Broker of Record.
Pricing Trends
A Sharp Monthly Drop,
Longer-Term Prices Also Lower
October’s average sale price was $4,284,179, down 37.1% from a year earlier. Detached homes averaged $4,793,350 across ten sales, down 39.1%, while semi-detached homes averaged $3,011,250 across four sales, down 35.8%.
The monthly figures are influenced by the mix of properties sold, so the longer-term measures offer additional context. Year to date, 58 homes have sold at an average of $4,453,943, down 11.6% year over year. Over the past 12 months, 63 homes sold at an average of $4,344,979, a decline of 16.2%. Both measures point to softer prices compared with the same periods last year.
- Same period last year
- This year
Changes are year over year. Source: TRREB MLS® sales data, Rosedale, to October 31, 2026;
statistics by Jethro Seymour, Broker of Record.
Speed of Sale
Homes Find Buyers
In Less Time
Rosedale homes sold in an average of 22 days in October, down from 41 days a year ago. Detached homes averaged 26 days, down from 45. Semi-detached homes moved fastest, averaging 14 days, compared with 34 last October.
The improvement in selling times points to stronger activity, although the results varied by property. Pricing and presentation remain important in attracting buyers and converting interest into an offer.
October 2026
October 2025
Source: TRREB MLS® sales data, Rosedale, October 1–31, 2026 and 2025;
statistics by Jethro Seymour, Broker of Record.
Feature Sales
Two Standout Sales,
Both on the First Listing
Highest Sale: Crescent Road
- Property type: Detached, 3-storey
- Lot size: 54.5 × 135 ft
- Bedrooms / bathrooms: 6 bed / 7 bath
- Size: about 3,500–5,000 sq ft
This detached, three-storey home on a 54.5 × 135 ft lot sold for $8,075,000, representing 92.5% of its asking price. It found a buyer in 13 days.
Second-Highest Sale: Pine Hill Road
- Property type: Detached, 2½-storey
- Lot size: 48.3 × 170 ft
- Bedrooms / bathrooms: 5 bed / 7 bath
- Size: about 3,500–5,000 sq ft
This detached, 2½-storey home on a 48.3 × 170 ft lot sold for $6,500,000, or 86.7% of its asking price, in just three days.
Both properties sold on their first listing, although each achieved a different result relative to its asking price.
What This Means
Advice for Buyers & Sellers
For Buyers
With 13 of October’s 14 sales closing below asking, there may be room to negotiate. The 27 active listings that have been on the market for more than 30 days are worth a closer look. Reviewing listing history, price changes and comparable sales can help identify where an offer may be well received.
For Sellers
The increase in sales and lower inventory are encouraging, but the results show that buyers are not accepting asking prices without negotiation. A realistic assessment of recent comparable sales and competing listings is essential when deciding how to price and position your home.
Thinking About Selling in Rosedale?
What could your home sell for right now? The answer depends on more than the neighbourhood average. Recent comparable sales, competing listings, property features and buyer demand all play a part. Jethro Seymour brings local market knowledge and a data-driven approach to help you understand your home’s position and plan your next move.
Curious about your home’s value?
Summary
Key Takeaways — October 2026
Semi $3,011,250 ▼ 35.8%
Changes are year over year
Compared with the 12 months before
Semi-detached: $4,250,000
January 1 to October 31, 2026
October 2026 Sales Breakdown
| Bedrooms | Sold | Avg. price | % of list | Days on market |
|---|---|---|---|---|
| 4 bedroom | 2 | $2,070,000 | 104% | 10 |
| 5 bedroom | 3 | $5,472,833 | 90% | 19 |
| 6 bedroom | 4 | $5,393,750 | 94% | 33 |
| 7 bedroom | 1 | $5,800,000 | 90% | 48 |
| Bedrooms | Sold | Avg. price | % of list | Days on market |
|---|---|---|---|---|
| 3 bedroom | 2 | $1,925,000 | 95% | 23 |
| 4 bedroom | 1 | $3,400,000 | 97% | 6 |
| 6 bedroom | 1 | $4,795,000 | 98% | 3 |
12-Month Price Average
- Homes sold, 12-month rolling (left)
- Average price, 12-month rolling (right)
See the figures
| 12 months to | Homes sold | Avg. price |
|---|---|---|
| Nov 2025 | 47 | $5,058,978 |
| Dec 2025 | 48 | $4,835,041 |
| Jan 2026 | 46 | $4,731,565 |
| Feb 2026 | 45 | $4,682,399 |
| Mar 2026 | 47 | $4,801,127 |
| Apr 2026 | 53 | $4,790,150 |
| May 2026 | 52 | $4,563,221 |
| Jun 2026 | 52 | $4,443,610 |
| Jul 2026 | 52 | $4,550,821 |
| Aug 2026 | 56 | $4,327,191 |
| Sep 2026 | 55 | $4,629,140 |
| Oct 2026 | 63 | $4,344,979 |
Each bar and point is the 12 months ending that month; the 12 months to October 2025 had 50 homes sold at an average of $5,184,379. Source: TRREB MLS® sales data to October 31, 2026;
statistics by Jethro Seymour, Broker of Record.
Zooming Out
More Activity,
Prices Still Under Pressure
October brought a clear increase in Rosedale sales, with the 12-month total rising 26% from a year earlier. Yet the average price over that period was down 16.2%, and the year-to-date average was also lower.
The market is moving more quickly, but that doesn’t mean every property is commanding a premium. With most October sales closing below asking, buyers continue to weigh value carefully. For sellers, the challenge is to price in line with current conditions and stand out among the available options.
Homes sold* ▲ 26%
- All homesup 26%to 63 homes sold
- Detachedup 31.4%to 46 homes sold
- Semi-detachedup 15.4%to 15 homes sold
Average price* ▼ 16.2%
- All homesdown 16.2%to $4,344,979
- Detacheddown 17.7%to $4,821,276
- Semi-detacheddown 14.6%to $3,120,333
*MLS 12-month year-over-year changes ending October 31, 2026; Provided by Jethro Seymour
Take the Next Step
Thinking About Your
Next Move in Rosedale?
Jethro Seymour knows Midtown Toronto and the numbers behind the market.
What is your home worth? Online estimates only tell part of the story.
Homes for sale in Rosedale
More Rosedale Market Updates
Market update
Rosedale Home Sales Statistics for September 2026 by Jethro Seymour Top Midtown Toronto Real Estate Broker
Midtown Toronto Realtor Jethro Seymour provides expert insights for Leaside, Davisville, Rosedale & Lawrence Park, Moore Park and Chaplin Estates real estate.

Market update
Rosedale Home Sales Statistics for June 2026 by Jethro Seymour Top Midtown Toronto Real Estate Broker
Midtown Toronto Realtor Jethro Seymour provides expert insights for Leaside, Davisville, Rosedale & Lawrence Park, Moore Park and Chaplin Estates real estate.
Market update
Rosedale Home Sales Statistics for May 2026 by Jethro Seymour Top Midtown Toronto Real Estate Broker
Midtown Toronto Realtor Jethro Seymour provides expert insights for Leaside, Davisville, Rosedale & Lawrence Park, Moore Park and Chaplin Estates real estate.