


Chaplin Estates Home Sales Statistics for February 2026 by Top Midtown Toronto Agent Jethro Seymour
Chaplin Estates in February 2026:
Patience is Part of the Market Here
By Jethro Seymour | The Seymour Team February brought no closed sales to Chaplin Estates — but that's not the story. With only 7 active listings and a 12-month rolling average of $2,541,148 across 39 sales, this remains one of Midtown Toronto's most tightly held and consistently valued neighbourhoods. A quiet month in a small market is normal. The fundamentals are intact and spring is around the corner. Missed the January recap? Read the January 2026 Chaplin Estates Market Report here. The Real Picture: Values Rising
The 12-month rolling data ending February 2026 tells a confident story. Average prices are up year-over-year, sales volume is holding steady, and days on market remain tight for a neighbourhood this exclusive.Volume is down 17% year-over-year — not because demand has softened, but because Chaplin Estates simply doesn't turn over often. Homeowners here stay. When properties do come to market at the right price, they move. The 20-day average DOM on detached homes confirms that.
February Snapshot: Selective and Watching
With no transactions closing in February, the active inventory picture heading into March tells us more than the monthly numbers can.- Active listings as of March 1st: 7
- New listings (under 30 days): 4
- Listings sitting 30+ days: 3
What's Available Right Now
With just 7 homes currently listed, here's the range buyers are working with heading into spring. Entry Point: $2,250,000 The lowest-priced active listing is a 6-bedroom, 8-bathroom 3-plex on Avenue Rd — on the market for 40 days. For an investor or multi-generational buyer, this represents a rare entry into Chaplin Estates at the lower end of the range. Top of Market: $5,198,000 The highest-priced active listing is a 4-bedroom, 5-bathroom detached home on Imperial St, listed just 4 days ago. Fresh to market and priced at the top of the neighbourhood's range — one to watch. For buyers, entry into Chaplin Estates now requires budgeting $2.25M+, with detached homes commanding $2.5M and above based on the 12-month rolling data. Inventory is thin — when the right home comes to market, it won't wait.Advice for Buyers & Sellers
For Buyers Chaplin Estates rarely offers much selection — 7 active listings is actually a relatively open window. With spring activity beginning to build and 4 fresh listings just hitting the market, now is the time to be engaged, pre-approved, and ready. The 20-day average DOM on detached homes means the best properties don't linger. For Sellers The 12-month rolling average of $2,541,148 — up 3.3% year-over-year — confirms that Chaplin Estates values have held and are moving in the right direction. The 3 listings currently stalled past 30 days are a reminder that even in a strong neighbourhood, overpricing delays outcomes and erodes leverage. Spring is the strongest selling window of the year — price accurately from day one and let the market reward you.Key Takeaways — February 2026
- 0 homes sold in February — typical for a small, low-turnover neighbourhood
- 12-month rolling average: $2,541,148 — up 3.3% year-over-year
- 39 homes sold over the past 12 months | Detached avg: $2,552,700
- Average DOM (detached): 20 days — well-priced homes move quickly
- 7 active listings as of March 1st | 4 new | 3 stalled 30+ days
- Price range: $2,250,000 (Avenue Rd) to $5,198,000 (Imperial St)
- Spring is the window — inventory is thin and buyer attention is building
Ready to Make Your Move in Chaplin Estates?
Whether you're buying or selling, Jethro Seymour's local expertise delivers results.
Thinking about selling? Find out what your Chaplin Estates home is worth in today's market.
Get a Home Valuation
February 2026 Sales
in Chaplin Estates
No homes closed in Chaplin Estates in February 2026. The 12-month rolling data below provides the most accurate picture of where values stand heading into spring.
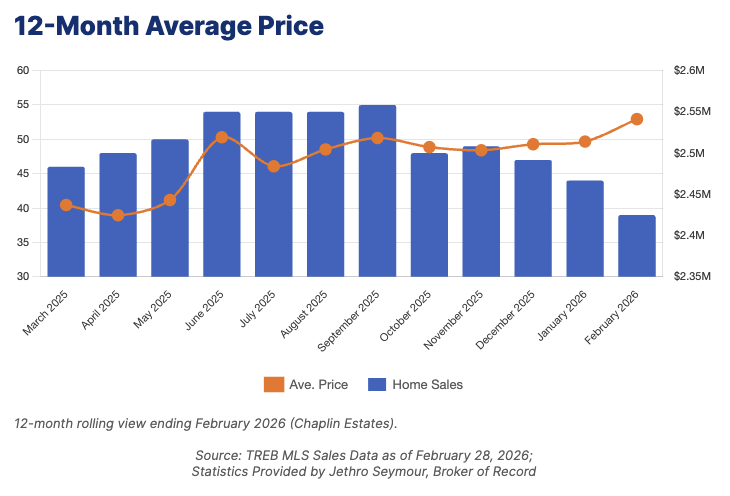
12-Month Average Price
| Month | Home Sales | Ave. Price |
|---|---|---|
| March 2025 | 46 | $2,436,980 |
| April 2025 | 48 | $2,424,606 |
| May 2025 | 50 | $2,443,042 |
| June 2025 | 54 | $2,519,131 |
| July 2025 | 54 | $2,483,946 |
| August 2025 | 54 | $2,504,422 |
| September 2025 | 55 | $2,518,269 |
| October 2025 | 48 | $2,507,204 |
| November 2025 | 49 | $2,503,343 |
| December 2025 | 47 | $2,510,719 |
| January 2026 | 44 | $2,513,904 |
| February 2026 | 39 | $2,541,148 |
Statistics Provided by Jethro Seymour, Broker of Record
Search Homes For Sale in
Chaplin Estates
Explore
Chaplin Estates
Previous Chaplin Estates
Home Sales Statistics
Chaplin Estates Home Sales Statistics for May 2026 by Top Midtown Toronto Agent Jethro Seymour
Chaplin Estates real estate market update by top Midtown Toronto Realtor Jethro Seymour. See sales volume changes, home prices, new listings, and expert insights for buyers and sellers across Midtown.
Chaplin Estates Home Sales Statistics for April 2026 by Top Midtown Toronto Agent Jethro Seymour
Chaplin Estates real estate market update by top Midtown Toronto Realtor Jethro Seymour. See sales volume changes, home prices, new listings, and expert insights for buyers and sellers across Midtown.
Chaplin Estates Home Sales Statistics for March 2026 by Top Midtown Toronto Agent Jethro Seymour
Chaplin Estates real estate market update by top Midtown Toronto Realtor Jethro Seymour. See sales volume changes, home prices, new listings, and expert insights for buyers and sellers across Midtown.
Jethro Seymour is one of the Top Toronto Real Estate Brokers and a midtown Toronto residential specialist with over 20 years of sales experience in real estate, marketing, construction, and publishing. He has helped many families find homes in Toronto’s great neighbourhoods, and has extensive knowledge of local markets, new home construction, resale home sales, and the condo market. Living in Midtown Toronto, Jethro previews many of the homes that come to market for his clients and inventory knowledge. Jethro specializes in Chaplin Estates, Deer Park, Summerhill and North Toronto.
Find Us in
Midtown Toronto
Royal LePage Terrequity
Seymour Real Estate
Toronto, ON M4P 1L3