


Chaplin Estates Home Sales Statistics for June 2026 by Top Midtown Toronto Agent Jethro Seymour
Chaplin Estates in June 2026:
Fewer Sales, Faster at the Right Price
By Jethro Seymour | The Seymour Team June brought Chaplin Estates its lightest month of the year by volume — just 3 homes sold — but that had little to do with buyer demand. The homes that did trade moved fast: average days on market fell to 8, a sharp improvement from a year ago, and two of the three sales closed at or above asking. The 12-month rolling detached average keeps building, now up more than 8% year-over-year. Fewer sellers are choosing to list, not fewer buyers looking — a distinction worth keeping in mind as the numbers below unfold. Missed the May recap? Read the May 2026 Chaplin Estates Market Report here. Sale Price
YoY Change
on Market
Smaller Pool, Firmer Footing
The 12-month rolling numbers through June 2026 tell a consistent story: a shrinking pool of transactions paired with values that keep building. The rolling average has pulled back slightly over the past two months, from April's $2,724,333 to $2,676,248 in May to $2,668,314 in June — but it remains well above where it stood a year ago. Volume, meanwhile, has thinned considerably, reflecting how few properties in Chaplin Estates are changing hands rather than any pullback in demand.Rolling DOM has tightened just as meaningfully, down to 18 days from 24 a year ago — a sign that the homes reaching the market are finding buyers faster than they were twelve months back, even with fewer of them changing hands. In a neighbourhood this tightly held, each sale carries outsized weight on the benchmark — which is exactly why June's feature sale matters as much as it does.
Three Sales, Sold in Days, Not Months
All three of June's sales were detached: one 3-bedroom home at $2,500,000 (102% of list, 6 days on market) and two 4-bedroom homes averaging $3,100,000 (102% of list, 10 days on market). Two of the three closed at or above their asking price. Volume is down sharply from June 2025 — 3 sales versus 8 a year ago — but the properties that did sell moved considerably faster, with average days on market cut roughly in half compared to what the neighbourhood was posting earlier in the spring.- Homes sold: 3 (all detached)
- Active listings as of July 1st: 11
- New listings in June: 5
- Listings sitting 30+ days: 6
- Homes sold at or above asking: 2 of 3 (67%)
- Entry price — Detached: $1.9M
June's Standout: Imperial Street
The month's top sale is a pricing lesson worth telling in full. A custom-built detached home spent the better part of seven months cycling through listing attempts before finally finding its number — and once it did, the market responded within days.- Property type: Detached — Chaplin Estates / Yonge-Eglinton
- Lot size: 61.5 × 90 ft
- Bedrooms / bathrooms: 4 bed / 5 bath
- Size: approx. 3,285 sq ft above grade
- Days on market: 11 (from final relist)
- Final sale price: $4,300,000
- Sold for: 108% of final list price ($3,980,000)
- Multiple listings since November 2025
Seven months of listings at the wrong number, then eleven days at the right one — and it still sold for more than it was asking. That's the market telling you exactly what it's willing to pay.
Jethro Seymour | The Seymour TeamWhat's Available Right Now
With 11 active listings as of July 1st, buyers have a modest but workable selection heading into summer. Five of the 11 are fresh to market; 6 have been sitting beyond 30 days — a reminder that not every listing in this neighbourhood is moving at Imperial Street's pace. Entry Point: $2,295,000 The lowest-priced active listing is a 4-bedroom detached on Hillsdale Ave W, and it's been sitting for 68 days — longer than any other listing currently on the market. For buyers looking to enter Chaplin Estates below $2.3M, it remains the option, though a timeline this long usually signals room to negotiate. Top of Market: $4,499,000 The highest-priced active listing is a 3-bedroom, 5-bathroom detached on Tarlton Rd at 42 days on market. It's asking within range of what Imperial Street ultimately achieved — a useful benchmark for what buyers at this level are willing to pay when a home is presented and priced well. Active inventory spans $2,295,000 to $4,499,000. Entry into Chaplin Estates for detached homes now sits at approximately $1.9M.Advice for Buyers & Sellers
For Buyers With 11 active listings against only 3 sales in June, there's more room to shop than the sales count alone suggests — but don't read that as a soft market. Two of June's three sales closed at or above asking, and days on market compressed hard. The Hillsdale Ave W listing at 68 days shows where negotiating room still exists; the Imperial Street result shows how quickly that room disappears once a home is priced correctly. Anchor your offers to the 12-month rolling average of $2,668,314 and move decisively on anything priced near it. For Sellers Imperial Street is this year's clearest lesson: four listing attempts and seven months to find the right number, then eleven days — and a sale price above the final ask — once it did. The math only worked after three separate price corrections. In a market this thin, the difference between a listing that stalls and one that sells fast almost always comes down to where you started.Key Takeaways — June 2026
- 3 homes sold — all detached (down from 8 in June 2025)
- 2 of 3 (67%) sold at or above asking
- June average sale price: $2,900,000 — up 3.8% year-over-year
- Average DOM: 8 days — down 65.2% year-over-year
- 12-month rolling average: $2,668,314 — up 5.9% year-over-year
- Detached rolling average: $2,761,156 — up 8.1% year-over-year
- 11 active listings as of July 1st | 5 new | 6 stalled 30+ days
- Feature sale: Imperial Street — $4,300,000, 108% of final list, 11 DOM, after multiple listings since November 2025
- Entry point: ~$1.9M detached
Ready to Make Your Move in Chaplin Estates?
Whether you're buying or selling, Jethro Seymour's local expertise delivers results.
Thinking about selling? Find out what your Chaplin Estates home is worth in today's market.
Get a Home Valuation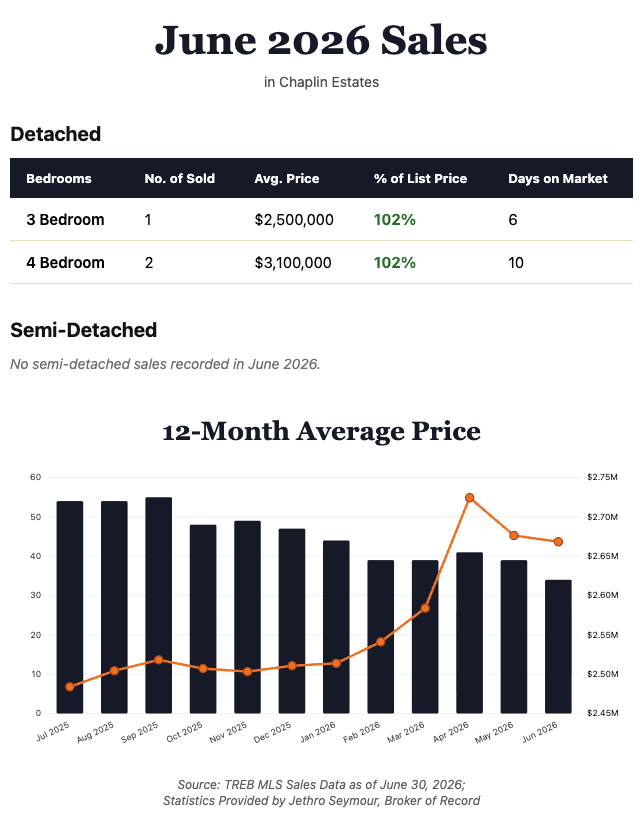
Search Homes For Sale in
Chaplin Estates
Explore
Chaplin Estates
Previous Chaplin Estates
Home Sales Statistics
Chaplin Estates Home Sales Statistics for July 2026 by Top Midtown Toronto Agent Jethro Seymour
Chaplin Estates real estate market update by top Midtown Toronto Realtor Jethro Seymour. See sales volume changes, home prices, new listings, and expert insights for buyers and sellers across Midtown.
Chaplin Estates Home Sales Statistics for May 2026 by Top Midtown Toronto Agent Jethro Seymour
Chaplin Estates real estate market update by top Midtown Toronto Realtor Jethro Seymour. See sales volume changes, home prices, new listings, and expert insights for buyers and sellers across Midtown.
Chaplin Estates Home Sales Statistics for April 2026 by Top Midtown Toronto Agent Jethro Seymour
Chaplin Estates real estate market update by top Midtown Toronto Realtor Jethro Seymour. See sales volume changes, home prices, new listings, and expert insights for buyers and sellers across Midtown.
Jethro Seymour is one of the Top Toronto Real Estate Brokers and a midtown Toronto residential specialist with over 20 years of sales experience in real estate, marketing, construction, and publishing. He has helped many families find homes in Toronto’s great neighbourhoods, and has extensive knowledge of local markets, new home construction, resale home sales, and the condo market. Living in Midtown Toronto, Jethro previews many of the homes that come to market for his clients and inventory knowledge. Jethro specializes in Chaplin Estates, Deer Park, Summerhill and North Toronto.
Find Us in
Midtown Toronto
Royal LePage Terrequity
Seymour Real Estate
Toronto, ON M4P 1L3