

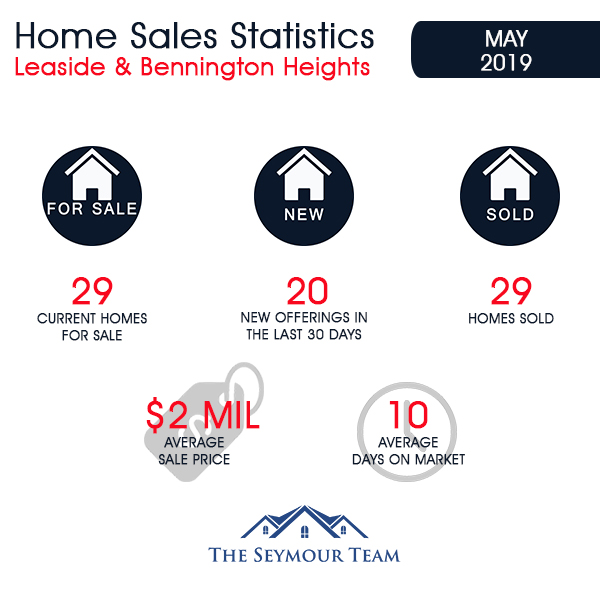
Leaside & Bennington Heights Home Sales for May 2019
 Sales Volume Changes*
All homes - up 12.8% to 150
Detached - up 8.6% to 114
Semi-detached - up 15.4% to 30
Dollar Value Changes*
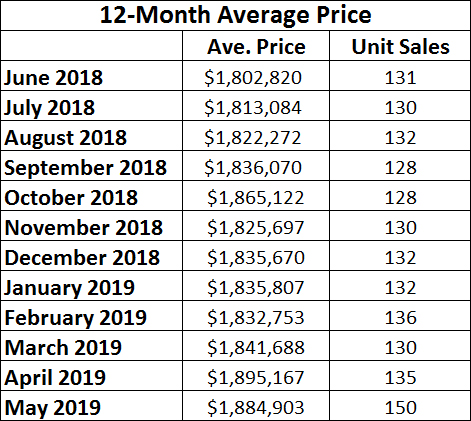
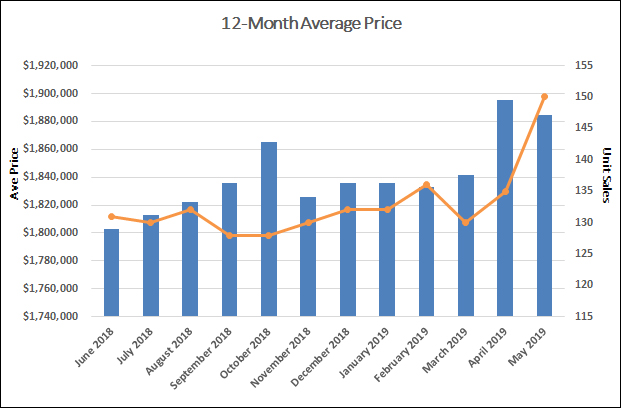
All homes - up 4.7% to $1,884,903
Detached - up 6.5% to $2,078,262
Semi-detached - down 2.5% to $1,212,455
*MLS 12-month year-over-year changes ending May 31, 2019; Provided by Jethro Seymour
Monthly Update
Twenty-nine homes changed hands in Leaside & Bennington Heights last month, including 22 detached, six semi-detached, and one attached home. This marks a 107.1% increase over last year's May 14 home sales. However, the average value of this year’s 29 transactions decreased to $1,922,345, a 6.7% drop over last year’s May mean of $2,061,429. Detached home values also dropped 1.3% over last May to reach an average of $2,115,182.
Year-To-Date Update
Over the first five months of 2019, 76 homes have changed hands in Leaside & Bennington Heights. This marks a 31% increase compared to the year-to-date May 2018 sales figures, which saw 58 completed transactions. Fifty-seven detached homes have changed hands so far this year, with an average value of $2,135,270. This is a 7.9% increase compared to the average sale price of $1,978,854 for the 46 detached homes that changed hands in May of 2018. Semi-detached home sales increased by 45.5% compared to last year, rising from 11 sales to 16. However, the average value dropped 4.2% from 2018, from $1,305,182 to $1,250,687.

Leaside & Bennington Heights monthly home sales up by 107.1% in 2019!
As of June 3, 2019, there are 29 homes on the market in the Leaside (C11) area, ranging in price from $1,125,000 for a semi-detached home on Southvale Drive (66 days on the market) to $4,000,000 for an amazing detached home on Douglas Crescent (28 days on the market).
Last month, Leaside properties sold an average of 10 days after listing. One home on Bessborough Drive sold one day after it was listed, while the longest lasted 31 days on the market. This doesn’t include the eight homes that have been listed for more than 30 days or the 20 homes that were listed in the month of May and are not selling at their current prices.
Thirteen homes sold at or above their initial asking prices. Last month’s most valuable Leaside sale involved a detached 4-bedroom, 6-bathroom home on a 45 x 160-foot lot with a private drive and garage on Southlea Avenue. It sold for $3,875,000, or 102% of the original listing price. It was followed by a home on Rykert Crescent, which sold for $3,350,000
or 99% of the asking price.
Entry into the Leaside market now requires buyers to spend $1,100,000 for a semi-detached and at least $1,300,000 for a detached home. Buyers continue to look for homes in midtown while low inventory endures as the main driver of competitive bidding.
Consider me your Leaside & Bennington Heights neighbourhood real estate expert and information resource. When it is time to move, I am here to help with insightful strategies, expert negotiation skills, and results-focused marketing plans.
View home sales statistics for April 2019 here.
May 2019 Sales in Leaside
& Bennington Heights
| Detached | No. of Sold | Avg. Price | % of List Price | Days on Market |
| 2 Bedroom | 3 | $1,390,000 | 102 | 11 |
| 3 Bedroom | 10 | $1,712,800 | 100 | 11 |
| 4 Bedroom | 8 | $2,828,250 | 98 | 12 |
| 6 Bedroom | 1 | $2,610,000 | 109 | 9 |
| Semi-detached | No. of Sold | Avg. Price | % of List Price | Days on Market |
| 2 Bedroom | 1 | $999,999 | 94 | 7 |
| 3 Bedroom | 5 | $1,328,800 | 105 | 7 |
| Attached | No. of Sold | Avg. Price | % of List Price | Days on Market |
| 4 Bedroom | 1 | $1,570,000 | 98 | 10 |
Source: TREB MLS Sales Data as of June 3, 2019
Statistics Provided by Jethro Seymour, Broker of Record


Jethro Seymour is one of the Top Leaside & Bennington Heights Real Estate Brokers and a midtown Toronto residential specialist with over 20 years of sales experience in real estate, marketing, construction and publishing. He has helped many families find homes in Toronto’s great neighbourhoods, and has extensive knowledge of local markets, new home construction, resale home sales, and the condo market. Living in midtown Toronto, Jethro previews many of the homes that come to market for his clients and inventory knowledge. Jethro specializes in Midtown, Davisville Village and Leaside neighbourhoods.