


Leaside Home Sales Statistics for January 2026 by Jethro Seymour Top Midtown Toronto Real Estate Broker
Leaside in January 2026: The Market Recalibrated — and Strategy Started Winning Again
Market Analysis by Jethro Seymour | The Seymour Team
January 2026 marked a significant turning point for the Leaside real estate market. After a robust 2025, this month's numbers tell a story of recalibration—and opportunity for buyers and sellers who understand what's happening as we head into the spring market.
January 2026 Market Snapshot
Market Overview: A Market in Transition
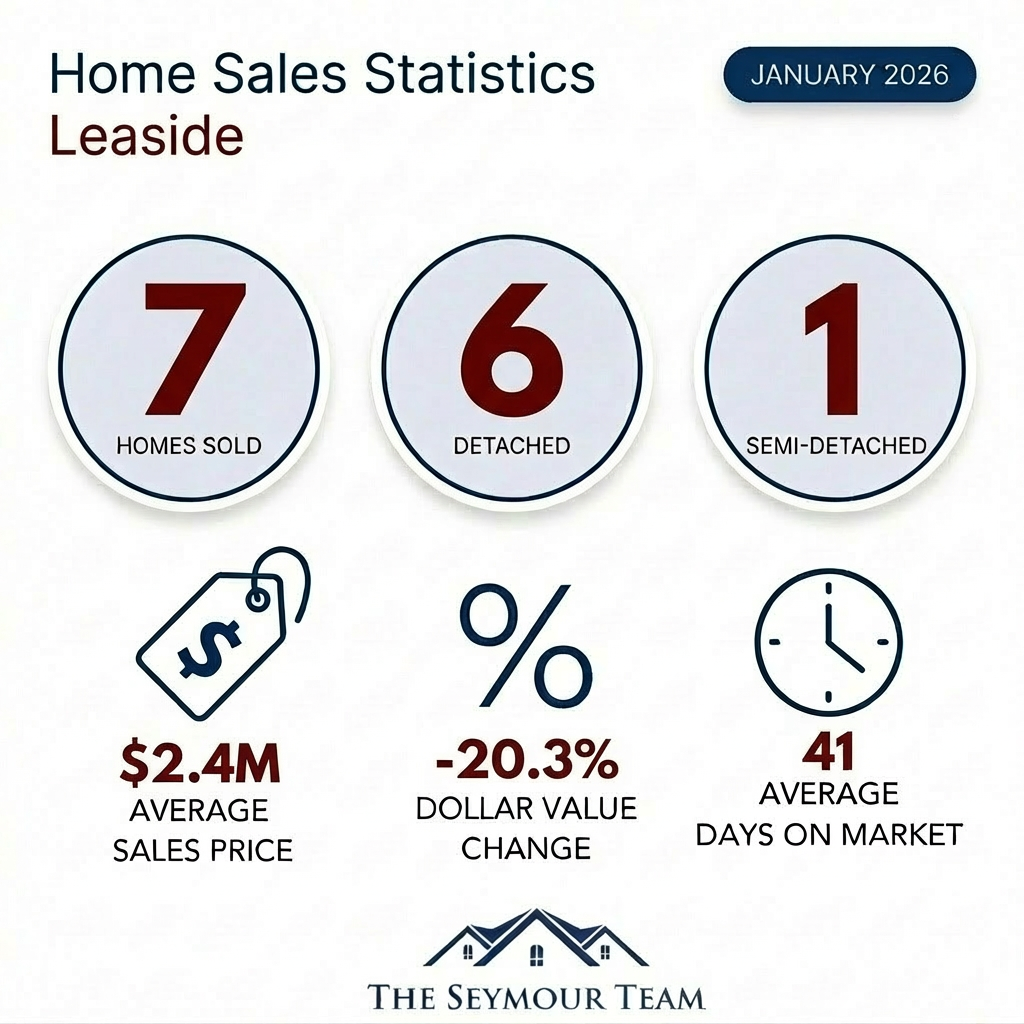
In January, only 7 homes sold in Leaside—6 detached and 1 semi-detached—with 18 active listings, 9 of which were newly listed.
Key market metrics:
- Months of inventory: 2.6 months (18 active listings ÷ 7 sales)
- Absorption rate: 38.9% (7 sales ÷ 18 active listings)
While these figures technically indicate a seller's market (under 4 months of inventory), the reality is far more nuanced. Sales volume increased 133.3% compared to January 2025, but days on market have jumped to 41 days—clear signals that buyer behavior has shifted significantly from the rapid-fire market of recent years.
Pricing Trends: Holding Steady Despite Lower Volume
The average sale price in January was $2,417,286:
- Detached homes: $2,590,167
- Semi-detached homes: $1,380,000 (limited data: 1 sale)
Compared to last year, the numbers reveal interesting dynamics:
- Overall dollar values: Down 2.5%
- Detached values: Up 4.4%
- Semi-detached values: Data limited (only 1 sale)
The rolling 12-month average sits at $2,393,244, down 1.5% overall from the previous year, with detached homes down 4.5% and semi-detached down 3.1%. This modest decline represents healthy market normalization after strong appreciation in prior years.
Speed of Sale: Pricing Discipline is Everything
Days on market reveal the new market reality:
- Overall average: 41 days (up 720.0% from January 2025's 5 days)
- Detached homes: 47 days (up 840.0% from last January)
- Semi-detached homes: 2 days (limited data: 1 sale)
This dramatic increase in market time highlights that pricing, presentation, and realistic expectations from day one are crucial. The rolling 12-month average DOM of 17 days (up 30.8% year-over-year) confirms the broader trend: well-priced homes can still move quickly, but overpriced properties can linger for months.
What's Driving This Shift?
- Seasonal slowdown amplified: January is traditionally slower, but the 41-day average DOM shows buyers are taking considerably more time than in previous years.
- Pricing discipline is critical: strategically priced homes still move; overpriced listings sit and require reductions.
- Buyer selectivity: with more time to evaluate properties, buyers are being more discerning—making value and presentation matter more than ever.
Leaside Highlight Sale: Glenvale Boulevard
Leaside's cautionary tale for January was Glenvale Boulevard—a custom-built home in North Leaside that sold for $3.188 million. Beautiful property, premium location. But it took 315 days and sold at 82% of the original asking price.
Property details:
- Property type: Detached
- Lot size: 30 x 132 ft
- Square footage: 2,425 sq ft
- Days on market: 315
- Final sale price: $3,188,000
- Sold for: 82% of original list price
- Price reduction required: $660,000
Compare that to well-priced homes moving quickly, and you can see exactly what buyers are responding to: reality-based pricing and exceptional presentation from day one. The lesson is clear: in this market, pricing strategy isn't just important—it's everything.
What This Means for Buyers and Sellers
For buyers:
Real opportunity exists. Prices have softened slightly (overall values down 2.5% from last January, though detached homes are up 4.4%), and you now have significantly more time to conduct due diligence. Sellers are more realistic, and you have meaningful negotiating leverage. But here's the critical point: well-priced, well-presented homes can still move fast. When you find the right property at the right price, be ready to act decisively.
Smart buyer strategy:
- Get pre-approved and know your buying power
- Work with a Leaside specialist who can identify value
- Move quickly on properly priced homes
- Don't try to time the absolute bottom—focus on long-term value
- Do thorough due diligence while you have the time
For sellers:
The market has fundamentally shifted from the rapid pace of recent years. Homes are now taking an average of 41 days to sell—dramatically longer than the 5 days we saw in January 2025. The most successful transactions go to homes that are priced right and presented exceptionally from day one. Overpricing leads to extended days on market—and deeper price cuts later.
Winning seller strategy:
- Price based on current market conditions and recent comparable sales
- Understand that buyers now have time to be selective
- Invest in staging, photography, and strong marketing
- Be prepared to negotiate—the market has normalized from ultra-hot conditions
- Remember: overpricing can cost you months on market and significant dollars in reductions
Key Takeaways
- Low January volume: only 7 sales (133.3% increase from Jan 2025's 3 sales)
- Pricing slightly softened: average sale price $2,417,286 (down 2.5% overall; detached up 4.4%)
- Days on market surging: 41 days average (up 720% from 5 days in Jan 2025)
- 12-month rolling average: $2,393,244 (down 1.5% overall; detached down 4.5%)
- Rolling 12-month DOM: 17 days (up 30.8% year-over-year)
- Strategic pricing is critical: well-priced homes move fast; overpriced homes sit
- Overpricing lesson: 315 DOM + $660K reduction shows the cost of mispricing
Leaside in January 2026 represents a market in transition—shifting from the ultra-fast pace of recent years to one where pricing discipline and presentation quality determine success. If you want a clear plan for Leaside in 2026, call The Seymour Team—we know exactly how to navigate this shift.
The Seymour Team Advantage
We don't just report numbers — we interpret them, provide actionable strategy, and help our clients navigate Leaside with confidence. If you're considering buying or selling in 2026, reach out for a personalized market review and plan.

Homes For Sale

Recently Sold in Leaside
January 2026 Sales
in Leaside
| Detached | No. of Sold | Avg. Price | % of List Price | Days on Market |
|---|---|---|---|---|
| 2 Bedroom | 1 | $1,625,000 | 96% | 5 |
| 3 Bedroom | 1 | $2,450,000 | 95% | 16 |
| 4 Bedroom | 4 | $2,866,500 | 97% | 65 |
| Semi-Detached | No. of Sold | Avg. Price | % of List Price | Days on Market |
|---|---|---|---|---|
| 3 Bedroom | 1 | $1,380,000 | 99% | 2 |
12-Month Average Price
| Month | Home Sales | Ave. Price |
|---|---|---|
| February 2025 | 155 | $2,470,265 |
| March 2025 | 152 | $2,473,707 |
| April 2025 | 138 | $2,451,992 |
| May 2025 | 140 | $2,452,615 |
| June 2025 | 137 | $2,440,098 |
| July 2025 | 143 | $2,423,514 |
| August 2025 | 141 | $2,442,755 |
| September 2025 | 132 | $2,423,602 |
| October 2025 | 139 | $2,375,090 |
| November 2025 | 139 | $2,378,097 |
| December 2025 | 142 | $2,393,891 |
| January 2026 | 146 | $2,393,244 |

Statistics Provided by Jethro Seymour, Broker of Record
Jethro Seymour is one of the Top Leaside & Bennington Heights Real Estate Brokers and a midtown Toronto residential specialist with over 20 years of sales experience in real estate, marketing, construction and publishing. He has helped many families find homes in Toronto’s great neighbourhoods, and has extensive knowledge of local markets, new home construction, resale home sales, and the condo market. Living in midtown Toronto, Jethro previews many of the homes that come to market for his clients and inventory knowledge. Jethro specializes in Midtown, Davisville Village and Leaside neighbourhoods.