


Moore Park Home Sales Statistics for January 2026 by Top Midtown Toronto Agent Jethro Seymour
Moore Park in January 2026: Scarcity, Speed, and Precision Pricing
Market Analysis by Jethro Seymour | The Seymour Team
Moore Park started 2026 with limited sales volume, but the market signals were unmistakable: scarce inventory and lightning-fast sales for well-priced properties.
January 2026 Market Snapshot
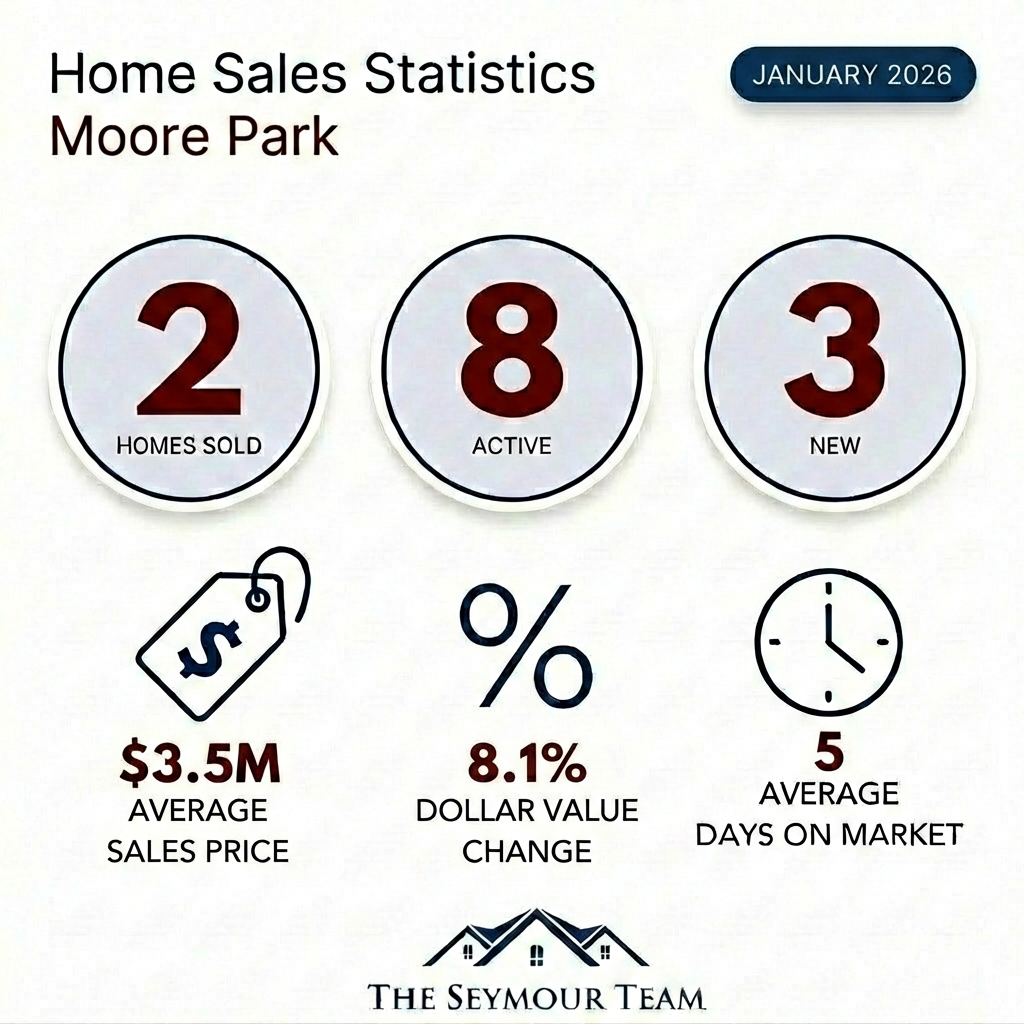
January posted just 2 home sales (both detached), with only 8 active listings and 3 new listings entering the market.
Key market metrics:
- Months of inventory: 4.0 months
- Absorption rate: 25%
- Average sale price: $3,520,000 (up 25% from January 2025)
- Average days on market: 5 days (down 80.8% from last year)
This points to a seller's market driven by scarcity—but pricing precision remains critical, as buyers won't overpay in today's environment.
The Speed Premium: Well-Priced Homes Move in Days
Both January sales closed over asking price and moved with exceptional speed. In a market with only 8 competing listings, properly positioned properties don't wait for buyers—buyers compete for them.
However, the broader context shows caution: the 12-month rolling average is down 12.8% year-over-year, signaling that while current conditions favor sellers, the market has cooled from 2025's momentum.
Moore Park Highlight Sale: Inglewood Drive
The standout sale was a luxury property in Inglewood Dr that demonstrated exactly what buyers respond to in Moore Park's premium market.
Property details:
- Property type: Detached, 3-storey
- Final sale price: $4,800,000
- Days on market: 1 day
- Sold for: 104% of list price
The lesson: Strategic pricing from day one created immediate urgency. The property sold in 24 hours over asking—proof that Moore Park buyers will pay premium prices for exceptional homes that are priced with market intelligence.
What This Means for Buyers and Sellers
For buyers:
Limited inventory (only 8 active listings) means limited choices. When the right property hits the market at the right price, expect competition and be ready to move decisively. Well-priced homes are selling in days, not weeks.
For sellers:
Low competition creates opportunity, but only if you price strategically. The difference between selling in 1 day over asking versus sitting for weeks comes down to pricing precision and presentation excellence. In a market this small, every listing is scrutinized—overpricing costs credibility and time.
Key Takeaways
- Ultra-low sales: 2 homes sold (down 33.3% from January 2025)
- Scarce inventory: 8 active listings, only 3 new this month
- Premium pricing: $3.52M average (up 25% year-over-year)
- Lightning speed: 5 average days on market (down 80.8%)
- Seller's market: 4.0 months of inventory
- Over-asking norm: Both sales exceeded list price (104-112%)
- Standout sale: Inglewood Dr—$4.8M in 1 day at 104% of asking
Moore Park in January 2026 is a market where scarcity meets strategy. If you want a clear plan for buying or selling in Moore Park this year, call The Seymour Team—we know exactly how to position your property for maximum results in minimal time.
Jethro Seymour
The Seymour Team
📞 416-712-0767
🌐 SeymourRealEstate.ca
January 2026 Sales
in Moore Park
| Detached | No. of Sold | Avg. Price | % of List Price | Days on Market |
|---|---|---|---|---|
| 3 Bedroom | 1 | $2,240,000 | 112% | 8 |
| 4 Bedroom | 1 | $4,800,000 | 104% | 1 |
| Semi-Detached | No. of Sold | Avg. Price | % of List Price | Days on Market |
|---|---|---|---|---|
| No Sales | 0 | — | — | — |
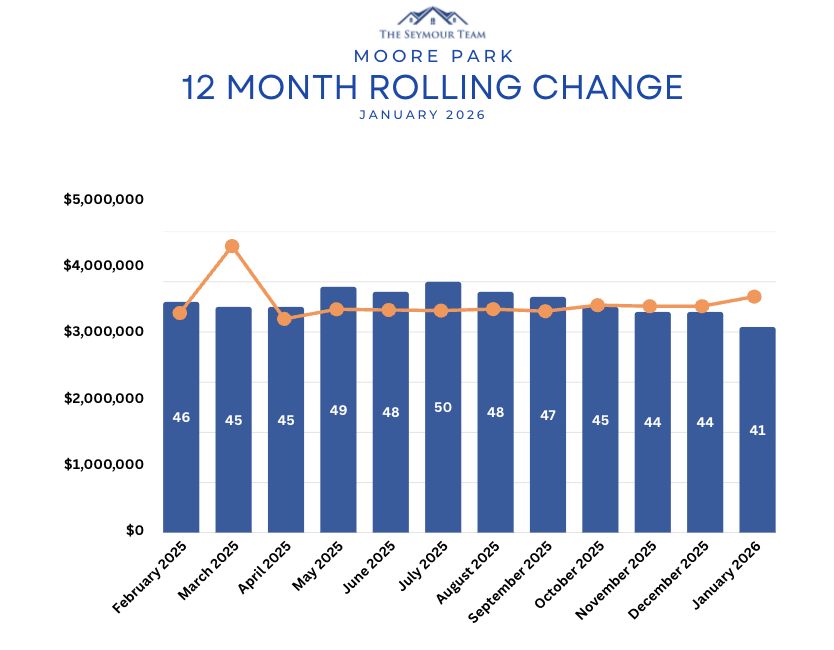
12-Month Average Price
| Month | Home Sales | Ave. Price |
|---|---|---|
| February 2025 | 46 | $3,290,230 |
| March 2025 | 45 | $4,300,000 |
| April 2025 | 45 | $3,201,539 |
| May 2025 | 49 | $3,347,149 |
| June 2025 | 48 | $3,335,944 |
| July 2025 | 50 | $3,326,758 |
| August 2025 | 48 | $3,349,185 |
| September 2025 | 47 | $3,317,466 |
| October 2025 | 45 | $3,408,796 |
| November 2025 | 44 | $3,393,292 |
| December 2025 | 44 | $3,393,292 |
| January 2026 | 41 | $3,537,689 |
Statistics Provided by Jethro Seymour, Broker of Record
Jethro Seymour is one of the Top Davisville Village Real Estate Brokers and a midtown Toronto residential specialist with over 20 years of sales experience in real estate, marketing, construction and publishing. He has helped many families find homes in Toronto’s great neighbourhoods, and has extensive knowledge of local markets, new home construction, resale home sales, and the condo market. Living in midtown Toronto, Jethro previews many of the homes that come to market for his clients and inventory knowledge. Jethro specializes in Moore Park, Davisville Village, Leaside and Midtown Toronto neighbourhoods.