


Chaplin Estates Home Sales Statistics for July 2026 by Top Midtown Toronto Agent Jethro Seymour
Chaplin Estates in July 2026:
Prices Are Holding — Buyers Aren't Rushing
By Jethro Seymour | The Seymour Team Just 2 homes sold in Chaplin Estates in July — both detached, both under asking, both taking roughly 100 days to close. That's not a one-month blip: the 12-month rolling sales count has been falling steadily all year, down 37% from a year ago. And yet the rolling and YTD average prices are both up double digits. Those two facts aren't contradictory, but they do need to be read together, not separately — which is what the numbers below are for. Missed the June recap? Read the June 2026 Chaplin Estates Market Report here. Sale Price
YoY Change
on Market
A Structural Decline, Not a Bad Month
The rolling sales count hasn't dropped suddenly — it's been sliding all year: 54 a year ago, down to 39 by February, 34 by June, still 34 by July. That's a 37% year-over-year decline, and it's been building for months, not one quiet stretch. What's notable is that price hasn't followed volume down. The rolling average moved from $2,483,946 a year ago to $2,688,903 now. But treat that as price resilience amid declining liquidity, not appreciation — with this few transactions, the average is highly sensitive to which specific homes happen to trade in a given window, not a read on the whole neighbourhood.One figure is worth sitting with rather than smoothing over: rolling detached DOM has improved (23 → 17 days, -26% year-over-year), but the year-to-date figure has gone the opposite direction (23 → 27 days, +17.4%) — and July's own two sales took 99 and 102 days. A 17-day rolling figure shouldn't suggest Chaplin is fast-moving right now — the most recent transactions say otherwise. With only 19 sales year-to-date, the aggregates are being shaped by the timing and mix of a small number of homes, not a consistent pace.
Two Sales, Neither at Asking
Both of July's sales were detached, and both closed under list — a first this year for Chaplin Estates, where 2 of 3 sales went at or above asking as recently as June. Average days on market jumped to 101, up from 8 in June and up 274% from July 2025. With a sample of 2, treat the monthly figures as noisy rather than decisive — but they're consistent with the slower pace showing up in the rolling and YTD numbers too.- Homes sold: 2 (both detached)
- Active listings as of August 1st: 9
- New listings in July: 1
- Listings sitting 30+ days: 8
- Homes sold at or above asking: 0 of 2 (0%)
- Entry price — Detached: $1.9M
July's Two Sales: Consistent, Not Contradictory
Different price points, same underlying pattern. Here's how each one actually played out.- Property type: Detached, 3-Storey — Forest Hill South, within the Chaplin Estates/C03 district
- Lot size: 73 × 105 ft
- Bedrooms / bathrooms: 4+1 bed / 5 bath
- Built: 1931 — extensively renovated with high-end finishes throughout
- Days on market: 99
- Final sale price: $3,250,000 (list: $3,499,900)
- Sold for: 93% of list price
- Property type: Detached, 2½-Storey — prime Chaplin Estates, Yonge-Eglinton
- Lot size: 32 × 100 ft
- Bedrooms / bathrooms: 4+2 bed / 3 bath
- Built: 1927 — original condition, renovation potential
- Days on market: 102
- Final sale price: $1,975,000 (list: $1,999,900)
- Sold for: 99% of list price
One home needed a discount, the other nearly hit its number — but both took roughly 100 days regardless. That's not about what buyers are willing to pay. It's about how long they're willing to take to commit.
Jethro Seymour | The Seymour TeamLimited Inventory, Very Slow Turnover
Chaplin Estates isn't oversupplied — only 9 homes are active as of August 1st, and just 1 came fresh to market in July. The issue isn't too many listings; it's that the ones already out there aren't clearing. 8 of the 9 have been sitting for more than 30 days. Entry Point: $2,395,000 The lowest-priced active listing is a 4-bedroom, 3-bathroom detached on Oriole Pkwy, already at 63 days on market — a long runway for buyers looking to negotiate their way into Chaplin Estates. Top of Market: $4,499,000 The highest-priced active listing is a 3-bedroom, 5-bathroom detached on Tarlton Rd — the same listing that topped June's report at 42 days, now at 80 days without a buyer. Active inventory spans $2,395,000 to $4,499,000. Entry into Chaplin Estates for detached homes holds at approximately $1.9M, unchanged from June.Advice for Buyers & Sellers
For Buyers Don't let the rolling and YTD price averages suggest you need to stretch — they're a mix effect from a handful of transactions, not proof the whole neighbourhood is appreciating. What the actual sales show is real leverage: neither of July's two homes sold at asking, both took over three months, and 8 of the 9 active listings have already been sitting a month or more. Patience is being rewarded right now. For Sellers The data doesn't say prices are falling — but it doesn't support pricing to the headline average and expecting a quick close, either. Both of July's sales needed roughly 100 days to find their buyer, and Duncannon Dr needed a discount despite an extensive high-end renovation. Buyers are still willing to pay Chaplin prices — just on their own timeline, not the seller's.Key Takeaways — July 2026
- 2 homes sold — both detached (down from 3 in June, structural decline all year — 54 sales a year ago to 34 now)
- 0 of 2 (0%) sold at or above asking
- July average sale price: $2,612,500 — up 15.5% year-over-year (small sample, treat with caution)
- Average DOM: 101 days — up 274% year-over-year
- 12-month rolling average: $2,688,903 — up 8.3% year-over-year across 34 sales, down 37% YoY in volume
- YTD average: $2,848,263 — up 12.9% year-over-year across 19 sales, down 40.6% YoY in volume
- DOM discrepancy flagged: rolling detached DOM improved (23→17 days, -26%) while YTD detached DOM worsened (23→27 days, +17.4%) — both real, both from a thin dataset
- 9 active listings as of August 1st | 1 new | 8 sitting 30+ days
- Feature sales: Duncannon Dr — $3,250,000, 93% of list, 99 DOM; Maxwell Ave — $1,975,000, 99% of list, 102 DOM
- Entry point: ~$1.9M detached, unchanged from June
Ready to Make Your Move in Chaplin Estates?
Whether you're buying or selling, Jethro Seymour's local expertise delivers results.
Thinking about selling? Find out what your Chaplin Estates home is worth in today's market.
Get a Home Valuation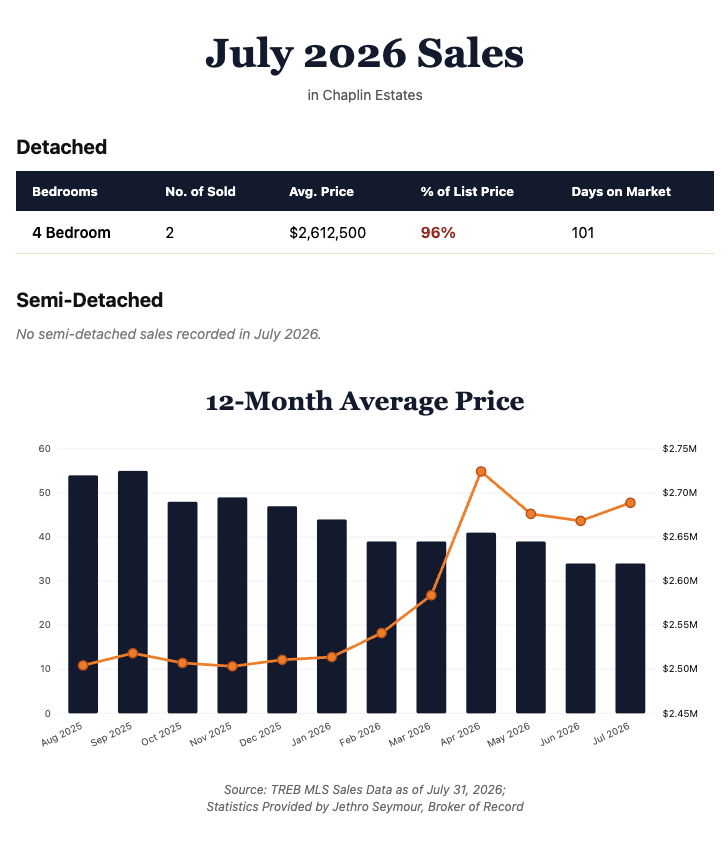
Search Homes For Sale in
Chaplin Estates
Explore
Chaplin Estates
Previous Chaplin Estates
Home Sales Statistics
Chaplin Estates Home Sales Statistics for June 2026 by Top Midtown Toronto Agent Jethro Seymour
Chaplin Estates real estate market update by top Midtown Toronto Realtor Jethro Seymour. See sales volume changes, home prices, new listings, and expert insights for buyers and sellers across Midtown.
Chaplin Estates Home Sales Statistics for May 2026 by Top Midtown Toronto Agent Jethro Seymour
Chaplin Estates real estate market update by top Midtown Toronto Realtor Jethro Seymour. See sales volume changes, home prices, new listings, and expert insights for buyers and sellers across Midtown.
Chaplin Estates Home Sales Statistics for April 2026 by Top Midtown Toronto Agent Jethro Seymour
Chaplin Estates real estate market update by top Midtown Toronto Realtor Jethro Seymour. See sales volume changes, home prices, new listings, and expert insights for buyers and sellers across Midtown.
Jethro Seymour is one of the Top Toronto Real Estate Brokers and a midtown Toronto residential specialist with over 20 years of sales experience in real estate, marketing, construction, and publishing. He has helped many families find homes in Toronto’s great neighbourhoods, and has extensive knowledge of local markets, new home construction, resale home sales, and the condo market. Living in Midtown Toronto, Jethro previews many of the homes that come to market for his clients and inventory knowledge. Jethro specializes in Chaplin Estates, Deer Park, Summerhill and North Toronto.
Find Us in
Midtown Toronto
Royal LePage Terrequity
Seymour Real Estate
Toronto, ON M4P 1L3