


Leaside Home Sales Statistics for March 2026 by Jethro Seymour Top Midtown Toronto Real Estate Agent
Leaside in March 2026:
Softens on the Surface, Strong at the Top
By Jethro Seymour | The Seymour Team March was a measured month in Leaside — 9 homes sold across 6 detached and 2 semi-detached, with 2 of 9 closing at or above asking price. Average prices eased year-over-year, though the figures reflect the mix of properties sold rather than broad market weakness. The top sale — a custom-built detached on Hanna Rd at 106% of list in just 4 days — is proof that the right home in Leaside still commands immediate competition. Missed the February recap? Read the February 2026 Leaside Market Report here. Sale Price*
YoY Change*
on Market
Selective Buyers, Tight Inventory
March brought 9 sales to Leaside with 14 active listings as of April 1st — 9 of which are newly listed this month. At 1.6 months of inventory, Leaside remains a seller's market, though buyers are exercising more patience than a year ago.- Homes sold: 9
- Months of inventory: 1.6
- Active listings as of April 1st: 14
- New listings this month: 9
- Listings sitting 30+ days: 5
- Homes sold at or above asking: 2 of 9 (22%)
Read the Numbers in Context
March's average sale price came in at $1,983,889 — down 19.2% year-over-year. That decline reflects the mix of properties sold, with lower-priced homes pulling the average down rather than a broad drop in Leaside values. The 12-month rolling average across 142 transactions tells the more complete story.*The YoY declines in March's monthly averages are largely a mix effect — with no high-end transactions closing this month, lower-priced homes dominate the sample. The 12-month rolling average of $2,314,928 across 142 sales remains the most reliable benchmark for where Leaside values truly stand. Entry into the market now requires buyers to budget at least $1.3M for semi-detached and $1.3M+ for detached.
Quality Moves, Overpriced Waits
Days on market rose sharply year-over-year — up 140% overall — but the story varies considerably by property type:- Overall average DOM: 36 days (up 140% YoY)
- Detached average DOM: 37 days (up 105.6% YoY)
- Semi-detached average DOM: 26 days (up 333.3% YoY)
Softens on Average, Strong at the Top
March's two highest sales tell the nuanced story of this market — one a swift over-asking result, the other a long road to resolution.- Property type: Detached
- Lot size: 34 x 135 ft
- Bedrooms / bathrooms: 4 bed / 6 bath
- Built: 2012 (custom red brick)
- Days on market: 4
- Final sale price: $3,510,000
- Sold for: 106% of list price
- Property type: Townhouse
- Lot size: 21 x 75 ft
- Bedrooms / bathrooms: 4 bed / 4 bath
- Days on market: 148 cumulative across 3 listings
- Final sale price: $2,900,000
- Sold for: 97% of list price
The market hasn't changed the formula. Price it right from day one and Leaside buyers will show up. The data proves it every month.
Jethro Seymour | The Seymour TeamWhat's Available Right Now
With 14 homes currently listed in Leaside as of April 1st, here's a snapshot of the range buyers are working with heading into spring. Entry Point: $1,499,000 The lowest-priced active listing is a semi-detached on Donegall Dr at 8 DOM — a relatively fresh listing at an accessible entry price for Leaside. Top of Market: $4,990,000 The highest-priced active listing is a detached on Leacrest Rd that has been listed 5 times since October 2025, originally asking $5,690,000. Now at $4,990,000 after 158 days on market, significant price discovery has already taken place. For a well-qualified buyer at the top end, the seller's journey tells its own story. The active inventory spans from $1,499,000 to $4,990,000 — reflecting the full range of Leaside's housing stock. Entry into the market now requires buyers to budget at least $1.3M for semi-detached and $1.3M+ for detached.Advice for Buyers & Sellers
For Buyers Leaside is offering more breathing room than it has in years — more selection, more realistic prices, and motivated sellers. That said, the top sale this month proves that the right home still draws immediate demand. Stay pre-approved, know your budget, and be ready to act when the right property comes along. For Sellers Hanna Rd vs. Evergreen Gdns is your lesson for spring. One sold in 4 days at 106% of asking. The other took 148 cumulative days across 3 listings. Same neighbourhood, same market, very different outcomes. Accurate pricing isn't a concession — it's the entire strategy. The sellers who will win this spring are the ones who start right.Key Takeaways — March 2026
- 9 homes sold: 6 detached, 2 semi-detached
- 2 of 9 homes (22%) sold at or above asking price
- March average sale price: $1,983,889 — down 19.2% YoY (mix effect, not a market collapse)
- YTD average: $2,159,318 across 22 sales — more reliable benchmark
- 12-month rolling average: $2,314,928 across 142 sales
- Average DOM: 36 days overall | Detached: 37 days | Semi: 26 days
- Top sale: Hanna Rd — 106% of list in just 4 days
- 5 of 14 active listings stalled 30+ days — overpricing remains the common denominator
- Months of inventory: 1.6 months — Seller's Market
Ready to Make Your Move in Leaside?
Whether you're buying or selling, Jethro Seymour's local expertise delivers results.
Thinking about selling? Find out what your Leaside home is worth in today's market.
Get a Home Valuation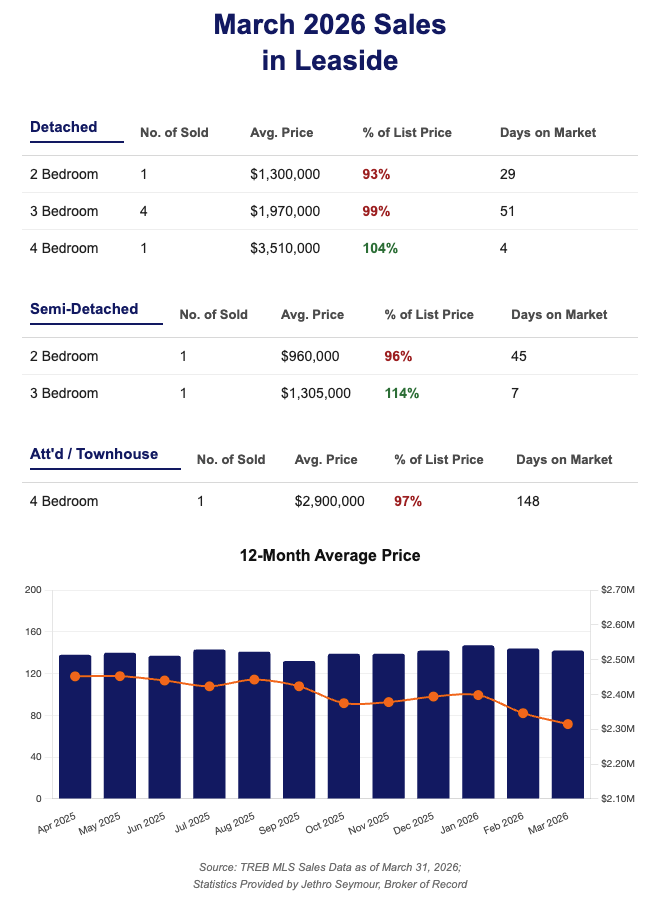
Search Homes For Sale in Leaside
Explore
Leaside
Previous Leaside
& Bennington Heights
Home Sales Statistics
Leaside Home Sales Statistics for May 2026 by Jethro Seymour Top Midtown Toronto Real Estate Agent
Explore Leaside’s latest real estate market update with Jethro Seymour, one of Midtown Toronto’s top Realtors. Covering Davisville, Leaside, Rosedale, Moore Park, Lawrence Park & Chaplin Estates. Trusted local insight for buyers and sellers.
Leaside Home Sales Statistics for April 2026 by Jethro Seymour Top Midtown Toronto Real Estate Agent
Explore Leaside’s latest real estate market update with Jethro Seymour, one of Midtown Toronto’s top Realtors. Covering Davisville, Leaside, Rosedale, Moore Park, Lawrence Park & Chaplin Estates. Trusted local insight for buyers and sellers.
Leaside Home Sales Statistics for February 2026 by Jethro Seymour Top Midtown Toronto Real Estate Agent
Explore Leaside’s latest real estate market update with Jethro Seymour, one of Midtown Toronto’s top Realtors. Covering Davisville, Leaside, Rosedale, Moore Park, Lawrence Park & Chaplin Estates. Trusted local insight for buyers and sellers.
Jethro Seymour is one of the Top Leaside & Bennington Heights Real Estate Brokers and a midtown Toronto residential specialist with over 20 years of sales experience in real estate, marketing, construction and publishing. He has helped many families find homes in Toronto’s great neighbourhoods, and has extensive knowledge of local markets, new home construction, resale home sales, and the condo market. Living in midtown Toronto, Jethro previews many of the homes that come to market for his clients and inventory knowledge. Jethro specializes in Midtown, Davisville Village and Leaside neighbourhoods.
Find Us in
Midtown Toronto
Royal LePage Terrequity
Seymour Real Estate
Toronto, ON M4P 1L3